| Market Summary | Weekly Breakout Report | Top Breakout Choices | Top 2nd Chances | New Features | Tip of the Week |
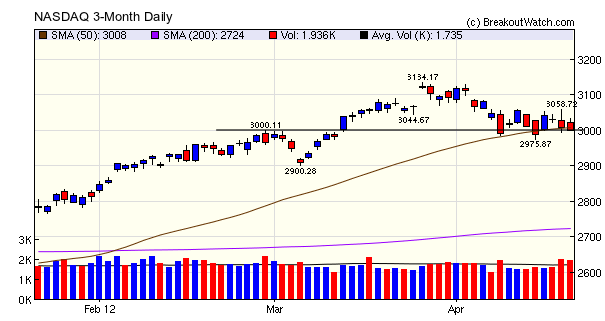
Our trend signal for the NASDAQ Composite turned down on April 16, joining the signals for the S&P 500 and DJI. The daily chart of the NASDAQ shows that so far the index continues to respect the support level at around 3000 and the 50-day dma, but the index closed below the 50-day average on Friday and the increasing volume on Thursday and Friday suggests strongly that this support level will soon fail. The most likely next move will be downward to test support at 2900.
No new features this week.
Pullbacks to Breakout Price Support
This week we look at another suggestion from a subcriber. He wanted to know how confirmed breakouts that pull back to near the breakout price subsequently perform.
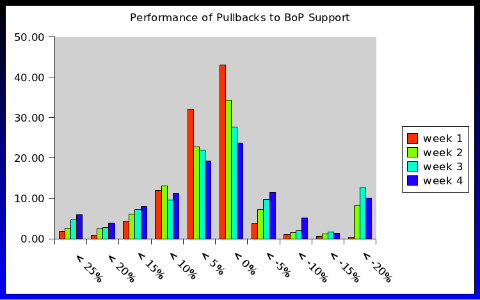
For this analysis, I looked at confirmed breakouts that pulled back to within +/- 1% of their breakout price within two weeks of breakout and found support at that level (that is, they never fell below -1% of the BoP during that two weeks). I had available the code that I've used for the last two weeks' analysis which I could quickly adapt so performed an analysis on the assumption that one bought at the support level and then looked at their performance after 1, 2, 3 and 4 weeks.
| Pullbacks to BoP Support | ||
| Winners | Losers | |
| Week 1 | 94.4% | 5.6% |
| Week 2 | 81.7% | 18.3% |
| Week 3 | 74.0% | 26% |
| Week 4 | 71.9% | 28.1% |
These results are preliminary and appear encouraging as they imply that buying pullbacks gives a success rate of 90% in the first week and that after 4 weeks there are still 72% that are above their BoP. However, the results require further analysis in order to develop an entry point strategy. The weakness with the analysis so far is that I selected stocks that never fall below -1% in the two weeks following breakout and yet in practice once a stock has fallen to within 1% of the BoP we cannot know if it will not fall further.
Time permitting, I'll dig deeper into these promising results next week.
If you have a strategy you would like me to analyse, drop me a line and let me know. This service is free to subscribers.
| Index | Value | Change Week | Change YTD | Trend | ||||||||||||||||||||||||||||||||||||
|---|---|---|---|---|---|---|---|---|---|---|---|---|---|---|---|---|---|---|---|---|---|---|---|---|---|---|---|---|---|---|---|---|---|---|---|---|---|---|---|---|
| Dow | 13029.3 | 1.4% | 6.64% | Down | ||||||||||||||||||||||||||||||||||||
| NASDAQ | 3000.45 | -0.36% | 15.17% | Down | ||||||||||||||||||||||||||||||||||||
| S&P 500 | 1378.53 | 0.6% | 9.62% | Down | ||||||||||||||||||||||||||||||||||||
| Russell 2000 | 804.05 | 0.97% | 8.52% | Up | ||||||||||||||||||||||||||||||||||||
1The Market Signal is derived from our proprietary
market model. The market model is described on the site. 2The site also shows industry rankings based on fundamentals, combined technical and fundamentals, and on price alone. The site also shows daily industry movements. |
||||||||||||||||||||||||||||||||||||||||
# of Breakouts |
Period Average1 |
Max. Gain During Period2 |
Gain at Period Close3 |
|
|---|---|---|---|---|
| This Week | 12 | 23.69 | 4.13% | 2.37% |
| Last Week | 14 | 24.38 | 67.25% | -3.49% |
| 13 Weeks | 294 | 25.23 | 18.88% |
-0.08% |
2This represents the return if each stock were bought at its breakout price and sold at its intraday high.
3This represents the return if each stock were bought at its breakout price and sold at the most recent close.
Category |
Symbol |
Company Name |
Expected Gain1 |
|---|---|---|---|
| Best Overall | SCLN | SciClone Pharmaceuticals, Inc. | 96 |
| Top Technical | SCLN | SciClone Pharmaceuticals, Inc. | 96 |
| Top Fundamental | HF | HFF, Inc. | 59 |
| Top Tech. & Fund. | HF | HFF, Inc. | 59 |
Category |
Symbol |
Company Name |
Expected Gain1 |
|---|---|---|---|
| Best Overall | DAL | Delta Air Lines, Inc. | 62 |
| Top Technical | GGG | Graco Inc. | 41 |
| Top Fundamental | HHC | Howard Hughes Corp | 27 |
| Top Tech. & Fund. | HHC | Howard Hughes Corp | 27 |
If you received this newsletter from a friend and you would like to receive it regularly please go to the BreakoutWatch.com site and enter as a Guest. You will then be able to register to receive the newsletter.
Copyright © 2012 NBIcharts, LLC dba BreakoutWatch.com.
All rights reserved.
"
BreakoutWatch," the BreakoutWatch.com "eye" logo, and the
slogan "tomorrow's breakouts today" are service marks of NBIcharts
LLC. All other marks are the property of their respective owners, and are
used for descriptive purposes only.
BreakoutWatch is not affiliated with Investor's Business Daily or with Mr. William O'Neil.
Our site, research and analysis is supported entirely by subscription and is free from advertising.