| Market Summary | Weekly Breakout Report | Top Breakout Choices | Top 2nd Chances | New Features | Tip of the Week |
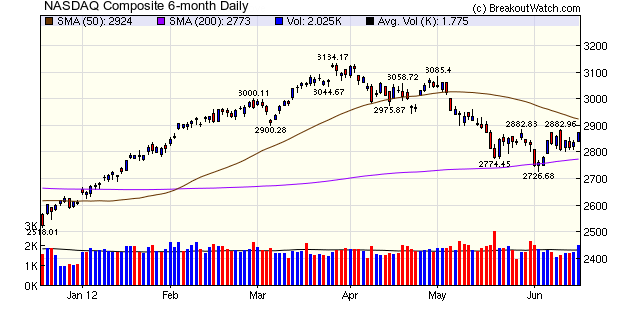
The NASDAQ continued to trend downward this week on low volume as the markets fretted over rising borrowing costs for Spain and the potentially disruptive effect of this Sunday's Greek election. Suddenly things looked less bleak on Friday as central banks, including the European Central Bank, said they were ready to inject extra capital if the Greek election outcome led to a run on the banks. The result was a surge on above average volume as traders reassessed their risk exposure more positively.
No new features this week.
Subscriber Strategy Analysis Redux
Last week we looked at a trading strategy based on
1. Buy stocks with an RS Rank >= 92 on breakout if BoP is above 8 day exponential moving average (EMA) and 21 day EMA.
2. Only buy if NASDAQ in uptrend
3. Sell at next open when 8 day EMA is lower than previous day in first decimal place
You can review the results in last weeks newsletter.
I suggested then that selling based on the 8 edma falling by a percentage amount may lead to better outcomes so I have rerun the analysis for several different sell stop options. Also, the subscriber who suggested the strategy, proposed that we require only that the 8 edma be rising, NOT that the breakout price be above the 8 edma.
With this change I ran the strategy again since January 2009 for all CwH breakouts with RS Rank >= 92 using a sell at open order if the 8 edma fell by 0.25%, 0.5%, 0.75% and 1%.
The average returns for each analysis were:
| Sell When 8 edma Falls |
Average Profit |
|---|---|
| 0.25% |
4.3% |
| 0.5% |
4.4% |
| 0.75% |
4.2% |
| 1% |
4.2% |
As you can see, increasing the stop value beyond 0.5% didn't improve results. For comparison, the average return in last week's analysis was 3.9%, so using a percentage based stop did produce a better outcome, with the best stop value being 0.5%. This gave a profit improvement of 13%.
The average number of days a trade was held also went up from 10.3 days to 13.7 days. A scatter plot and histogram showing the profit distribution follow.
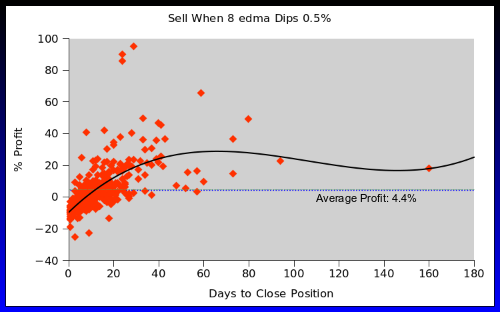
The scatter plot shows that very few
trades fail after 20 days, so if a sell signal (8 edma drops by 0.5%)
has not been given by then, consider adding to the position as it is
likely to improve further.
I fitted a polynomial to the plot and this shows clearly that very few trades improve after 60 days, so it would be wise to take profits by then.
I fitted a polynomial to the plot and this shows clearly that very few trades improve after 60 days, so it would be wise to take profits by then.
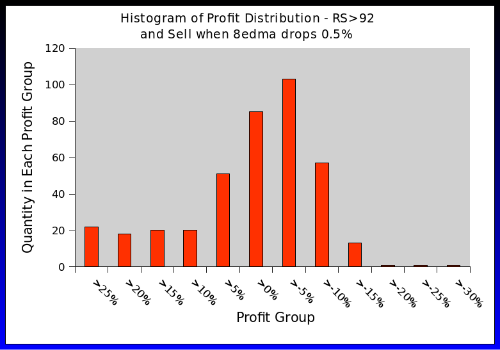
The histogram shows clearly that there are many more winning trades than losing ones (actually 217 to 175).
These profits are based on being able to buy at the breakout price and sell at the open on the day after the sell signal. While the sell at open prices used in the simulation are achievable, being able to buy at the breakout price is theoretical only. In practice slippage will likely reduce profit margins by 1-2%. Nevertheless, if a trader follows this strategy and reinvests profits, then the accumulated gain over time could be substantial.
These profits are based on being able to buy at the breakout price and sell at the open on the day after the sell signal. While the sell at open prices used in the simulation are achievable, being able to buy at the breakout price is theoretical only. In practice slippage will likely reduce profit margins by 1-2%. Nevertheless, if a trader follows this strategy and reinvests profits, then the accumulated gain over time could be substantial.
| Index | Value | Change Week | Change YTD | Trend | ||||||||||||||||||||||||||||||||||||
|---|---|---|---|---|---|---|---|---|---|---|---|---|---|---|---|---|---|---|---|---|---|---|---|---|---|---|---|---|---|---|---|---|---|---|---|---|---|---|---|---|
| Dow | 12767.2 | 1.7% | 4.5% | Up | ||||||||||||||||||||||||||||||||||||
| NASDAQ | 2872.8 | 0.5% | 10.27% | Down | ||||||||||||||||||||||||||||||||||||
| S&P 500 | 1342.84 | 1.3% | 6.78% | Up | ||||||||||||||||||||||||||||||||||||
1The Market Signal is derived from our proprietary
market model. The market model is described on the site. 2The site also shows industry rankings based on fundamentals, combined technical and fundamentals, and on price alone. The site also shows daily industry movements. |
||||||||||||||||||||||||||||||||||||||||
# of Breakouts |
Period Average1 |
Max. Gain During Period2 |
Gain at Period Close3 |
|
|---|---|---|---|---|
| This Week | 14 | 10.54 | 4.45% | 3.58% |
| Last Week | 19 | 12.62 | 5.23% | 3.3% |
| 13 Weeks | 197 | 13.31 | 4.73% |
-2.96% |
2This represents the return if each stock were bought at its breakout price and sold at its intraday high.
3This represents the return if each stock were bought at its breakout price and sold at the most recent close.
Category |
Symbol |
Company Name |
Expected Gain1 |
|---|---|---|---|
| Best Overall | TRR | TRC Companies, Inc. | 107 |
| Top Technical | TRR | TRC Companies, Inc. | 107 |
| Top Fundamental | LOPE | Grand Canyon Education Inc | 56 |
| Top Tech. & Fund. | LOPE | Grand Canyon Education Inc | 56 |
Category |
Symbol |
Company Name |
Expected Gain1 |
|---|---|---|---|
| Best Overall | OMPI | Obagi Medical Products, Inc. | 69 |
| Top Technical | OMPI | Obagi Medical Products, Inc. | 69 |
| Top Fundamental | OMPI | Obagi Medical Products, Inc. | 69 |
| Top Tech. & Fund. | OMPI | Obagi Medical Products, Inc. | 69 |
If you received this newsletter from a friend and you would like to receive it regularly please go to the BreakoutWatch.com site and enter as a Guest. You will then be able to register to receive the newsletter.
Copyright © 2012 NBIcharts, LLC dba BreakoutWatch.com.
All rights reserved.
"
BreakoutWatch," the BreakoutWatch.com "eye" logo, and the
slogan "tomorrow's breakouts today" are service marks of NBIcharts
LLC. All other marks are the property of their respective owners, and are
used for descriptive purposes only.
BreakoutWatch is not affiliated with Investor's Business Daily or with Mr. William O'Neil.
Our site, research and analysis is supported entirely by subscription and is free from advertising.