| Market Summary | Weekly Breakout Report | Top Breakout Choices | Top 2nd Chances | New Features | Tip of the Week |
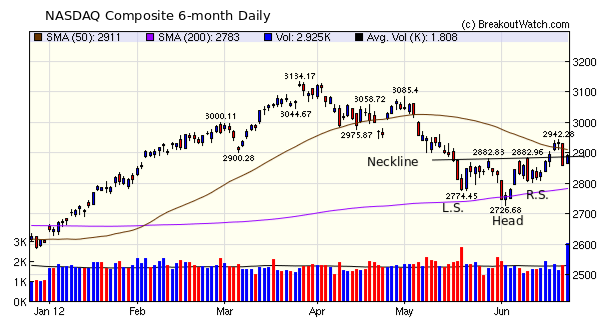
The NASDAQ Composite is working through a head and shoulders bottom. The chart shows the head, left and right shoulders and neckline. The breakout through the neckline on Tuesday was bullish but Thursday's collapse followed by Friday's strong rally shows how skittish the markets are. Technically speaking, another breakout above the neckline would be bullish but there are reasons to think that such a breakout would be no more reliable than Tuesday's was. We are being assailed by bad news, and the potential for more bad news, in the domestic and global economies at the same time as geopolitical risk is rising: we have news that the US is covertly involved in Syria, uncertainty over the Egyptian elections, a possible strike against Iran as well as the ongoing mess in Afghanistan and Pakistan. Markets react positively or negatively by the minute to news of each event as they perceive the news to imply risk on or risk off, and traders, particularly high frequency algorithmically driven trades, exaggerate the price swings.
These frequent swings add 'noise' to the underlying trend which makes it difficult to identify. Notice how the daily candlesticks to the left of the April high are generally smaller than those to the right of it and recent movements have been particularly large. In this market it is preferable to hold positions for only a few minutes or hours before taking a profit as the market can quickly move against you.
For the nimble breakoutwatch subscriber there are healthy profits to be made in this volatile market. Notice that there were 16 breakouts this week that made an average gain of 7.7% (admittedly this was driven mainly by two stocks, SUNH and ONXX) and last week there were 14 breakouts that made an average gain to their intraday high of 10%, with several making 8% intraday gains. (see our Monitor > Recent Breakouts report).
No new features this week
I am taking a vacation until mid-July. This feature will return on July 20.
| Index | Value | Change Week | Change YTD | Trend | ||||||||||||||||||||||||||||||||||||
|---|---|---|---|---|---|---|---|---|---|---|---|---|---|---|---|---|---|---|---|---|---|---|---|---|---|---|---|---|---|---|---|---|---|---|---|---|---|---|---|---|
| Dow | 12640.8 | -0.99% | 3.46% | Up | ||||||||||||||||||||||||||||||||||||
| NASDAQ | 2892.42 | 0.68% | 11.03% | Down | ||||||||||||||||||||||||||||||||||||
| S&P 500 | 1335.02 | -0.58% | 6.16% | Up | ||||||||||||||||||||||||||||||||||||
1The Market Signal is derived from our proprietary
market model. The market model is described on the site. 2The site also shows industry rankings based on fundamentals, combined technical and fundamentals, and on price alone. The site also shows daily industry movements. |
||||||||||||||||||||||||||||||||||||||||
# of Breakouts |
Period Average1 |
Max. Gain During Period2 |
Gain at Period Close3 |
|
|---|---|---|---|---|
| This Week | 16 | 11.46 | 7.73% | 5.06% |
| Last Week | 14 | 10.54 | 9.99% | 7.2% |
| 13 Weeks | 209 | 11.85 | 5.72% |
-1.87% |
2This represents the return if each stock were bought at its breakout price and sold at its intraday high.
3This represents the return if each stock were bought at its breakout price and sold at the most recent close.
Category |
Symbol |
Company Name |
Expected Gain1 |
|---|---|---|---|
| Best Overall | BGMD | BG Medicine, Inc. | 114 |
| Top Technical | BGMD | BG Medicine, Inc. | 114 |
| Top Fundamental | CATM | Cardtronics, Inc. | 38 |
| Top Tech. & Fund. | GEOI | GeoResources, Inc. | 40 |
Category |
Symbol |
Company Name |
Expected Gain1 |
|---|---|---|---|
| Best Overall | LGF | Lions Gate Entertainment Corp. (USA) | 64 |
| Top Technical | MLNX | Mellanox Technologies, Ltd. | 41 |
| Top Fundamental | ECHO | Echo Global Logistics, Inc. | 53 |
| Top Tech. & Fund. | ECHO | Echo Global Logistics, Inc. | 53 |
If you received this newsletter from a friend and you would like to receive it regularly please go to the BreakoutWatch.com site and enter as a Guest. You will then be able to register to receive the newsletter.
Copyright © 2012 NBIcharts, LLC dba BreakoutWatch.com.
All rights reserved.
"
BreakoutWatch," the BreakoutWatch.com "eye" logo, and the
slogan "tomorrow's breakouts today" are service marks of NBIcharts
LLC. All other marks are the property of their respective owners, and are
used for descriptive purposes only.
BreakoutWatch is not affiliated with Investor's Business Daily or with Mr. William O'Neil.
Our site, research and analysis is supported entirely by subscription and is free from advertising.