| Market Summary | Weekly Breakout Report | Top Breakout Choices | Top 2nd Chances | New Features | Tip of the Week |
Our trend model considers the NASDAQ Composite to be still in an upward trend but a descending triangle pattern shows that the trend is weakening. The index is making higher lows, which is positive, but lower highs shows market participants, which are increasingly computer driven trades rather than human beings, are doubtful that the index can move higher. 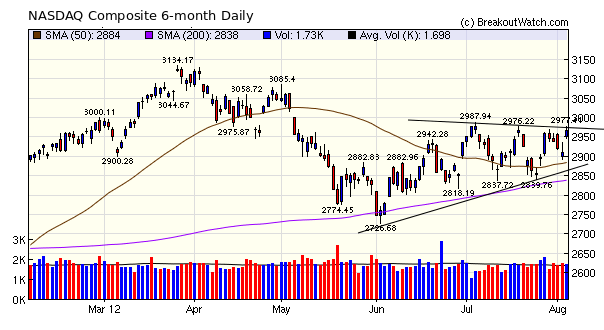 Since the index represents the aggregate performance of its component stocks, it is evident that expectations for strongly successful breakouts must be lowered. This is shown in the breakout results for the week with only 11 successful breakouts with an average gain of 3.68%. |
No new features this week.
These are perilous times for the private investor who is not able to follow the market in real time. Even then the volatility introduced by high frequency trading makes it almost impossible for the private investor to be agile enough to make profits. Our long and short position pattern recognition algorithms can be successful when there is a clear bull or bearish trend, but when the market trends are weak as at present, it is better to stay on the sidelines and keep your powder dry for another day. This needs patience as it could be months or years before the markets return to their primary function of raising capital for company expansion. |
| Index | Value | Change Week | Change YTD | Trend | ||||||||||||||||||||||||||||||||||||
|---|---|---|---|---|---|---|---|---|---|---|---|---|---|---|---|---|---|---|---|---|---|---|---|---|---|---|---|---|---|---|---|---|---|---|---|---|---|---|---|---|
| Dow | 13096.2 | 0.16% | 7.19% | Up | ||||||||||||||||||||||||||||||||||||
| NASDAQ | 2967.9 | 0.33% | 13.92% | Up | ||||||||||||||||||||||||||||||||||||
| S&P 500 | 1390.99 | 0.36% | 10.61% | Up | ||||||||||||||||||||||||||||||||||||
1The Market Signal is derived from our proprietary
market model. The market model is described on the site. 2The site also shows industry rankings based on fundamentals, combined technical and fundamentals, and on price alone. The site also shows daily industry movements. |
||||||||||||||||||||||||||||||||||||||||
# of Breakouts |
Period Average1 |
Max. Gain During Period2 |
Gain at Period Close3 |
|
|---|---|---|---|---|
| This Week | 11 | 13.54 | 4.25% | 3.68% |
| Last Week | 24 | 13.69 | 6.47% | 5.29% |
| 13 Weeks | 232 | 14.54 | 8.15% |
2.82% |
2This represents the return if each stock were bought at its breakout price and sold at its intraday high.
3This represents the return if each stock were bought at its breakout price and sold at the most recent close.
Category |
Symbol |
Company Name |
Expected Gain1 |
|---|---|---|---|
| Best Overall | ADY | Feihe International Inc | 104 |
| Top Technical | ADY | Feihe International Inc | 104 |
| Top Fundamental | NSM | Nationstar Mortgage Holdings Inc | 52 |
| Top Tech. & Fund. | NSM | Nationstar Mortgage Holdings Inc | 52 |
Category |
Symbol |
Company Name |
Expected Gain1 |
|---|---|---|---|
| Best Overall | NCT | Newcastle Investment Corp. | 96 |
| Top Technical | NCR | NCR Corporation | 55 |
| Top Fundamental | HPY | Heartland Payment Systems, Inc. | 42 |
| Top Tech. & Fund. | HPY | Heartland Payment Systems, Inc. | 42 |
If you received this newsletter from a friend and you would like to receive it regularly please go to the BreakoutWatch.com site and enter as a Guest. You will then be able to register to receive the newsletter.
Copyright © 2012 NBIcharts, LLC dba BreakoutWatch.com.
All rights reserved.
"
BreakoutWatch," the BreakoutWatch.com "eye" logo, and the
slogan "tomorrow's breakouts today" are service marks of NBIcharts
LLC. All other marks are the property of their respective owners, and are
used for descriptive purposes only.
BreakoutWatch is not affiliated with Investor's Business Daily or with Mr. William O'Neil.
Our site, research and analysis is supported entirely by subscription and is free from advertising.