| Market Summary | Weekly Breakout Report | Top Breakout Choices | Top 2nd Chances | New Features | Tip of the Week |
No new features this week.
Last week we ran a simulation of the CwH Backtest tool to seek the most profitable buy criteria since June, 2012 using the Buy on Alert strategy. This week we repeat the exercise for the Buy at Open strategy. The buy at open strategy is for those who cannot react to intra-day alerts and instead do their trading at the next open based on the breakouts that occurred during the day. This generally means placing an overnight order that will be executed the next day.
The simulation was done for 4 positions (meaning that 1/4 of available cash was used for each buy) using all combinations of criteria in the following ranges:
- BoP Stop Loss %: 5 to 10 in 1% increments
- Trailing Stop: 2 to 8 in 1% increments
- Min. Vol. to Adv Ratio %: 1.25 to 2 in 0.25% increments
- Confirmation Vol. Ratio %: 1.25 to 2.5 in 0.25% increments
- Top Industry percentile: 25 to 50 in 1 percentile increments
The criteria that gave the best results were quite similar to those obtained for the buy on alert strategy. The only exception was that the industry selection filter was more restrictive by requiring that the industry be in the top 27% of industry rankings.
- BoP Stop Loss %: 5%
- Trailing Stop: 7%
- Min. Vol. to Adv Ratio %: 1.25
- Confirmation Vol. Ratio %: 1.5 (doesn't really
apply with this strategy)
- Top Industry percentile: 27
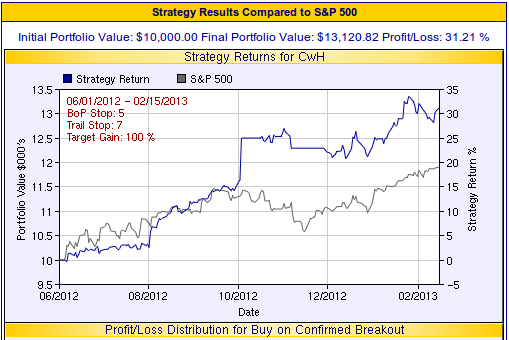
The 4 position strategy since June 1, 2012 provided a
31.2% gain - slightly less than the 46% gain obtained
with the buy on alert strategy but still better than the
19% gain in the S&P 500 over the same period.
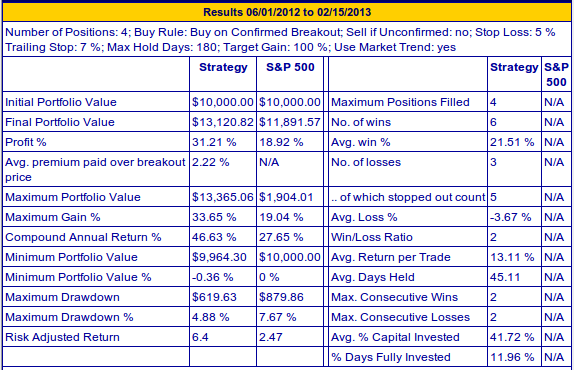
These results were obtained by optimizing the selection criteria over historical data. While the period of the backtest was representative of recent market conditions, the exact sequence of trades represented will never be repeated and so future results using these criteria, could be better or worse.
| Index | Value | Change Week | Change YTD | Trend | ||||||||||||||||||||||||||||||||||||
|---|---|---|---|---|---|---|---|---|---|---|---|---|---|---|---|---|---|---|---|---|---|---|---|---|---|---|---|---|---|---|---|---|---|---|---|---|---|---|---|---|
| Dow | 13981.8 | -0.08% | 6.7% | Up | ||||||||||||||||||||||||||||||||||||
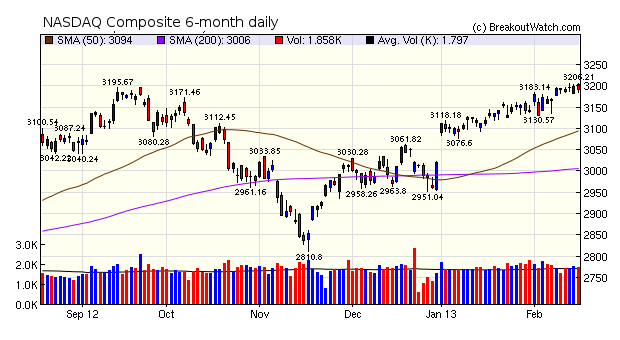
| NASDAQ | 3192.03 | -0.06% | 5.71% | Up | ||||||||||||||||||||||||||||||||||||
| S&P 500 | 1519.79 | 0.12% | 6.56% | Up | ||||||||||||||||||||||||||||||||||||
1The Market Signal is
derived from our proprietary market model. The
market model is described on the site.
2The site also shows industry rankings based on fundamentals, combined technical and fundamentals, and on price alone. The site also shows daily industry movements. |
||||||||||||||||||||||||||||||||||||||||
|
# of Breakouts
|
Period Average1
|
Max. Gain During Period2
|
Gain at Period Close3
|
|
|---|---|---|---|---|
| This Week | 13 | 20.15 | 4.34% | 3.01% |
| Last Week | 12 | 19.62 | 5.91% | 4.27% |
| 13 Weeks | 275 | 20.62 | 11.68% |
7.39% |
2This represents the return if each stock were bought at its breakout price and sold at its intraday high.
3This represents the return if each stock were bought at its breakout price and sold at the most recent close.
|
Category
|
Symbol
|
Company Name
|
Expected Gain1
|
|---|---|---|---|
| Best Overall | RGEN | Repligen Corporation | 100 |
| Top Technical | RGEN | Repligen Corporation | 100 |
| Top Fundamental | SLCA | U.S. Silica Holdings Inc | 65 |
| Top Tech. & Fund. | SLCA | U.S. Silica Holdings Inc | 65 |
|
Category
|
Symbol
|
Company Name
|
Expected Gain1
|
|---|---|---|---|
| Best Overall | VTNC | Vitran Corporation, Inc. (USA) | 93 |
| Top Technical | AGO | Assured Guaranty Ltd. | 39 |
| Top Fundamental | CAMP | CalAmp Corp. | 78 |
| Top Tech. & Fund. | CAMP | CalAmp Corp. | 78 |
If you received this newsletter from a friend and you would like to receive it regularly please go to the BreakoutWatch.com site and enter as a Guest. You will then be able to register to receive the newsletter.
Copyright © 2013 NBIcharts, LLC dba
BreakoutWatch.com. All rights reserved.
" BreakoutWatch," the BreakoutWatch.com "eye" logo, and
the slogan "tomorrow's breakouts today" are service marks
of NBIcharts LLC. All other marks are the property of
their respective owners, and are used for descriptive
purposes only.
BreakoutWatch is not affiliated with Investor's Business
Daily or with Mr. William O'Neil.
Our site, research and analysis is supported entirely by
subscription and is free from advertising.