| Market Summary | Weekly Breakout Report | Top Breakout Choices | Top 2nd Chances | New Features | Tip of the Week |
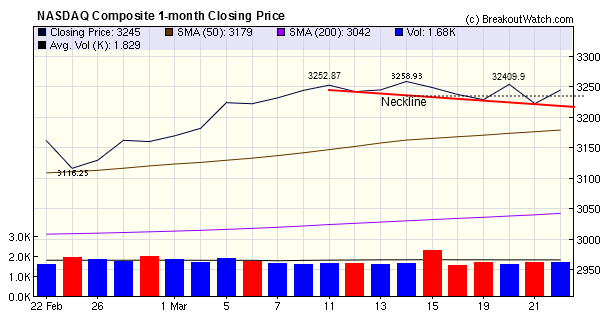
Our market trend indicators all turned down at the end of the week, so it looks as though the markets are at last moving into consolidation mode after a stellar rise in the first three months of this year. The NASDAQ Composite formed a Head and Shoulders Top pattern which is usually bearish. The normal rule for assessing the expected decline from the top is to measure the difference between the top and the neckline on the day of the top (dotted line). As you can see the H&S Top pattern is quite shallow and the index touched the target low according to this rule on Thursday, so we may already have seen the full extent of the correction. Note also that volume has been well below the 50 day average indicating falling momentum.
Our research shows that when our trend indicators turn negative, breakout performance suffers. You can confirm this using our backtest tools by toggling the market indicators filter.
Server Upgrade Outcome
Our server upgrade last weekend was not successful as our real-time price feed failed on Monday morning. We quickly reverted operations to our old server but because internet name servers can take over 24 hours to synchronize, some of you experienced connection difficulties into Tuesday. In compensation, I have extended everyone's subscription by two days. We will try the upgrade again this Friday as the markets are closed that day.
No new features this week.
This feature will return after the server upgrade in two weeks.
| Index | Value | Change Week | Change YTD | Trend | ||||||||||||||||||||||||||||||||||||
|---|---|---|---|---|---|---|---|---|---|---|---|---|---|---|---|---|---|---|---|---|---|---|---|---|---|---|---|---|---|---|---|---|---|---|---|---|---|---|---|---|
| Dow | 14512 | -0.01% | 10.74% | Down | ||||||||||||||||||||||||||||||||||||
| NASDAQ | 3245 | -0.13% | 7.47% | Down | ||||||||||||||||||||||||||||||||||||
| S&P 500 | 1556.89 | -0.24% | 9.16% | Down | ||||||||||||||||||||||||||||||||||||
1The Market Signal is
derived from our proprietary market model. The
market model is described on the site.
2The site also shows industry rankings based on fundamentals, combined technical and fundamentals, and on price alone. The site also shows daily industry movements. |
||||||||||||||||||||||||||||||||||||||||
|
# of Breakouts
|
Period Average1
|
Max. Gain During Period2
|
Gain at Period Close3
|
|
|---|---|---|---|---|
| This Week | 13 | 18.62 | 2.79% | 1.52% |
| Last Week | 24 | 19.62 | 2.2% | -0.92% |
| 13 Weeks | 268 | 20.62 | 12.41% |
6.21% |
2This represents the return if each stock were bought at its breakout price and sold at its intraday high.
3This represents the return if each stock were bought at its breakout price and sold at the most recent close.
|
Category
|
Symbol
|
Company Name
|
Expected Gain1
|
|---|---|---|---|
| Best Overall | CRTX | Cornerstone Therapeutics, Inc. | 106 |
| Top Technical | CRTX | Cornerstone Therapeutics, Inc. | 106 |
| Top Fundamental | DGI | DigitalGlobe Inc | 46 |
| Top Tech. & Fund. | DGI | DigitalGlobe Inc | 46 |
|
Category
|
Symbol
|
Company Name
|
Expected Gain1
|
|---|---|---|---|
| Best Overall | RFIL | RF Industries, Ltd. | 101 |
| Top Technical | NYT | The New York Times Company | 61 |
| Top Fundamental | RFIL | RF Industries, Ltd. | 101 |
| Top Tech. & Fund. | RFIL | RF Industries, Ltd. | 101 |
If you received this newsletter from a friend and you would like to receive it regularly please go to the BreakoutWatch.com site and enter as a Guest. You will then be able to register to receive the newsletter.
Copyright © 2013 NBIcharts, LLC dba BreakoutWatch.com.
All rights reserved.
" BreakoutWatch," the BreakoutWatch.com "eye" logo, and
the slogan "tomorrow's breakouts today" are service marks
of NBIcharts LLC. All other marks are the property of
their respective owners, and are used for descriptive
purposes only.
BreakoutWatch is not affiliated with Investor's Business
Daily or with Mr. William O'Neil. Our site, research and
analysis is supported entirely by subscription and is free
from advertising.