| Market Summary | Weekly Breakout Report | Top Breakout Choices | Top 2nd Chances | New Features | Tip of the Week |
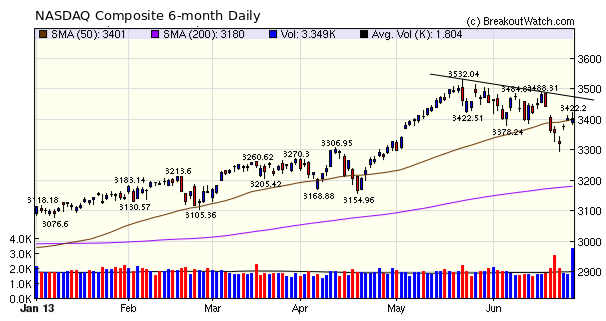
A volatile week closed with a rally on Friday supported by a volume level almost twice the recent average. Our trend indicators for the large cap indexes (DJI and S&P 500) are now positive while the NASDAQ indicator is still negative. The NASDAQ closed slightly above its 50 day average on Friday and I expect the trend will reverse soon. Look for the index to trade between its 50 day average and the downward sloping trend line shown on this week's NASDAQ chart. A break above that trend line would be bullish.
The number of breakouts jumped to 14 this week - more than triple those of last week, and above the recent average. While we generally recommend caution while our NASDAQ trend indicator is down, this may be the time to bend the rule and take a long position or two in anticipation of a likely reversal of trend.
No new features this week. But if you missed some recent newsletters then take a look at:
New Slope Indicator
New individual stock Trend Reversal Signals
What should be your target gain?
This may seem like a silly question in the light of the oft told adage "let your winners run" but I believe its better to take early profits so you can move on to the next winner.
The fact is, most breakouts don't make big gains before suffering a setback. Once a stock has gained, say 20%, how likely is it that it will make another 20% compared to a new position making 20%? I don't have the exact answer to that but we do have a way to test when you should be satisfied with the gain you have using our CwH backtest tool.
Using the buy and sell criteria recently published for stocks since January 1 this year (see New Strategy Suggestions, I ran the backtest tool with successively increasing target gains. (Setting a target gain forces the backtest tool to sell the stock when that gain is reached. The backtest tool then buys the next breakout to come along.) I ran the backtest for holding just one position and four positions simultaneously. Here are the results.
| Target Gain | Profit % | ||
|---|---|---|---|
| 1 position | 4 positions | ||
| 10 | 30.9 | 13.1 | |
| 15 | 44.0 | 16.0 | |
| 20 | 46.1 | 17.5 | |
| 25 | 42.0 | 16.5 | |
| 30 | 42.0 | 16.5 | |
| 35 | 42.0 | 16.5 | |
| 40 | 42.0 | 16.5 | |
As you can see, the optimum time to sell is when your profit reaches 20%. This causes you to forgo any further, possibly slight gains, in preference to taking a new position with a potentially higher gain. Note that if you go for a target above 25% your gains plateau as you will most likely be stopped out of a position.
If you are wondering why a 4 position strategy is less profitable, it's because only 1/4 of your capital is invested in any one position, but the number of times there are 4 breakouts that meet the buy conditions is rare, so you are rarely fully invested.
| Index | Value | Change Week | Change YTD | Trend | ||||||||||||||||||||||||||||||||||||
|---|---|---|---|---|---|---|---|---|---|---|---|---|---|---|---|---|---|---|---|---|---|---|---|---|---|---|---|---|---|---|---|---|---|---|---|---|---|---|---|---|
| Dow | 14909.6 | 0.74% | 13.78% | Up | ||||||||||||||||||||||||||||||||||||
| NASDAQ | 3403.25 | 1.37% | 12.71% | Down | ||||||||||||||||||||||||||||||||||||
| S&P 500 | 1606.28 | 0.87% | 12.63% | Up | ||||||||||||||||||||||||||||||||||||
1The Market Signal is derived
from our proprietary market model. The market model is
described on the site.
2The site also shows industry rankings based on fundamentals, combined technical and fundamentals, and on price alone. The site also shows daily industry movements. |
||||||||||||||||||||||||||||||||||||||||
|
# of Breakouts
|
Period Average1
|
Max. Gain During Period2
|
Gain at Period Close3
|
|
|---|---|---|---|---|
| This Week | 14 | 11.08 | 3.23% | 2.39% |
| Last Week | 4 | 11.23 | 4.49% | 2.04% |
| 13 Weeks | 156 | 12.31 | 12.04% |
1.69% |
2This represents the return if each stock were bought at its breakout price and sold at its intraday high.
3This represents the return if each stock were bought at its breakout price and sold at the most recent close.
|
Category
|
Symbol
|
Company Name
|
Expected Gain1
|
|---|---|---|---|
| Best Overall | ICAD | iCAD Inc | 102 |
| Top Technical | ICAD | iCAD Inc | 102 |
| Top Fundamental | EPM | Evolution Petroleum Corp | 56 |
| Top Tech. & Fund. | EPM | Evolution Petroleum Corp | 56 |
|
Category
|
Symbol
|
Company Name
|
Expected Gain1
|
|---|---|---|---|
| Best Overall | SNAK | Inventure Foods Inc | 86 |
| Top Technical | MTDR | Matador Resources Co | 52 |
| Top Fundamental | INVN | InvenSense Inc | 58 |
| Top Tech. & Fund. | INVN | InvenSense Inc | 58 |
If you received this newsletter from a friend and you would like to receive it regularly please go to the BreakoutWatch.com site and enter as a Guest. You will then be able to register to receive the newsletter.
Copyright © 2013 NBIcharts, LLC dba BreakoutWatch.com. All rights
reserved.
" BreakoutWatch," the BreakoutWatch.com "eye" logo, and the slogan
"tomorrow's breakouts today" are service marks of NBIcharts LLC.
All other marks are the property of their respective owners, and
are used for descriptive purposes only.
BreakoutWatch is not affiliated with Investor's Business Daily or
with Mr. William O'Neil. Our site, research and analysis is
supported entirely by subscription and is free from advertising.