| Market Summary | Weekly Breakout Report | Top Breakout Choices | Top 2nd Chances | New Features | Tip of the Week |
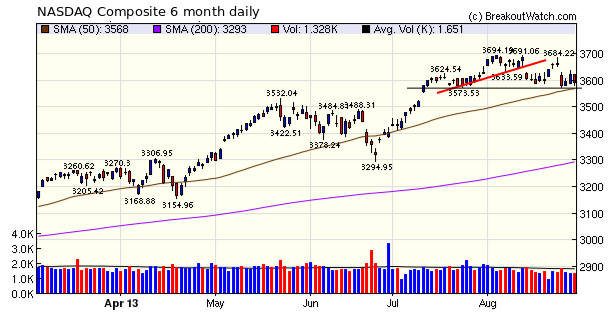
Our market trend signals for the three major indexes are pointing down. The NASDAQ Composite completed a head and shoulders pattern on 8/15 when it crashed through the neckline (red line on chart) but found support at 3573. I expect the markets will move sideways until the strike against Syria is decided for or against. If there is no strike , markets are likely to move up otherwise down as fears of disruption to oil supplies multiply.
The number of breakouts fell to just two this week in the face of uncertainty and low volume. This is a good time to stay on the sidelines until the market direction becomes clearer.
No new features this
week.
Last week I hypothesized that opening a position when a stock first reached the Relative Strength rank of 92 may be more profitable than waiting for a breakout with that RS level. Preliminary results show that this is not the case but I am not yet ready to confirm or disprove the hypothesis. Final results should be available next week.
| Index | Value | Change Week | Change YTD | Trend | ||||||||||||||||||||||||||||||||||||
|---|---|---|---|---|---|---|---|---|---|---|---|---|---|---|---|---|---|---|---|---|---|---|---|---|---|---|---|---|---|---|---|---|---|---|---|---|---|---|---|---|
| Dow | 14810.3 | -1.33% | 13.02% | Down | ||||||||||||||||||||||||||||||||||||
| NASDAQ | 3589.87 | -1.86% | 18.89% | Down | ||||||||||||||||||||||||||||||||||||
| S&P 500 | 1632.97 | -1.84% | 14.5% | Down | ||||||||||||||||||||||||||||||||||||
1The Market Signal is derived
from our proprietary market model. The market model is
described on the site.
2The site also shows industry rankings based on fundamentals, combined technical and fundamentals, and on price alone. The site also shows daily industry movements. |
||||||||||||||||||||||||||||||||||||||||
|
# of Breakouts
|
Period Average1
|
Max. Gain During Period2
|
Gain at Period Close3
|
|
|---|---|---|---|---|
| This Week | 2 | 8.23 | 16.72% | -5.43% |
| Last Week | 6 | 9 | 9.78% | 6.1% |
| 13 Weeks | 104 | 9.15 | 19.19% |
6.57% |
2This represents the return if each stock were bought at its breakout price and sold at its intraday high.
3This represents the return if each stock were bought at its breakout price and sold at the most recent close.
|
Category
|
Symbol
|
Company Name
|
Expected Gain1
|
|---|---|---|---|
| Best Overall | ASTX | Astex Pharmaceuticals, Inc. | 114 |
| Top Technical | ASTX | Astex Pharmaceuticals, Inc. | 114 |
| Top Fundamental | EPL | EPL Oil & Gas Inc | 49 |
| Top Tech. & Fund. | EPL | EPL Oil & Gas Inc | 49 |
|
Category
|
Symbol
|
Company Name
|
Expected Gain1
|
|---|---|---|---|
| Best Overall | |||
| Top Technical | |||
| Top Fundamental | |||
| Top Tech. & Fund. |
If you received this newsletter from a friend and you would like to receive it regularly please go to the BreakoutWatch.com site and enter as a Guest. You will then be able to register to receive the newsletter.
Copyright © 2013 NBIcharts, LLC dba BreakoutWatch.com. All rights
reserved.
" BreakoutWatch," the BreakoutWatch.com "eye" logo, and the slogan
"tomorrow's breakouts today" are service marks of NBIcharts LLC.
All other marks are the property of their respective owners, and
are used for descriptive purposes only.
BreakoutWatch is not affiliated with Investor's Business Daily or
with Mr. William O'Neil.
Our site, research and analysis is supported entirely by
subscription and is free from advertising.