| Market Summary | Weekly Breakout Report | Top Breakout Choices | Top 2nd Chances | New Features | Tip of the Week |
I
apologize for the re-transmission , but some images were
missing from the first version.
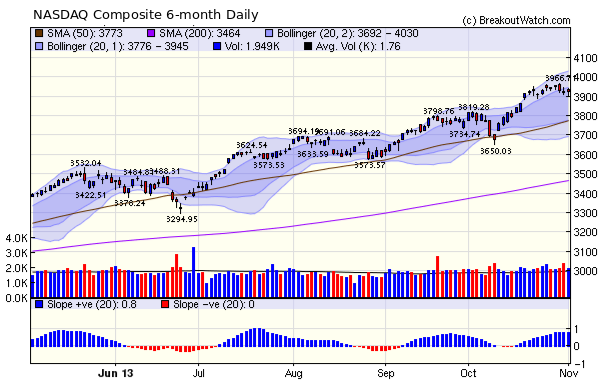
Our market trend indicators remain positive but some profit taking produced two distribution days for the NASDAQ Composite this week. The NASDAQ was the only major index to close down (0.5%). Although volume remained above the 50 day average each day, significantly these distribution days were not offset by any accumulation days. Our slope chart, which is a proxy for momentum clearly shows the index is moving into consolidation, so we can expect fewer breakouts as prices drift down. That trend is already apparent with only 8 modest breakouts this week.
Keltner Channel and Squeeze indicator
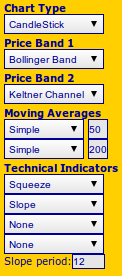 Our
Technical Analysis charts received two new indicators this week :
Keltner Channels and a Squeeze indicator. The charts also now have
the ability to show two channel overlays simultaneously. This
allows the display of Bollinger Bands and Keltner Channels
together from which the Squeeze indicator is derived.
Our
Technical Analysis charts received two new indicators this week :
Keltner Channels and a Squeeze indicator. The charts also now have
the ability to show two channel overlays simultaneously. This
allows the display of Bollinger Bands and Keltner Channels
together from which the Squeeze indicator is derived.A Keltner Channel is similar to a Bollinger Band but is less volatile. Like the BB, it is an indicator of oversold or overbought conditions, but in neither case are they automatic sell or buy signals when prices move outside the channel or band.
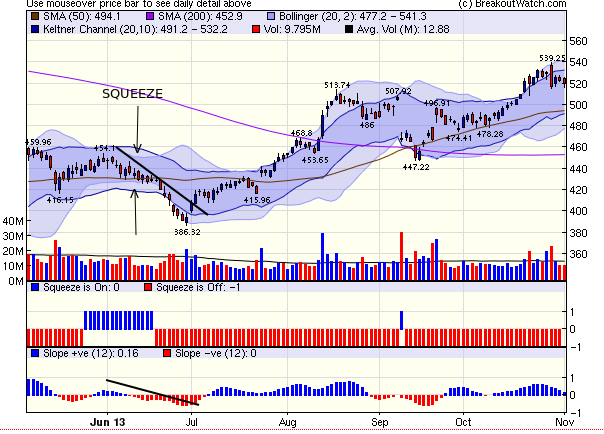
A Squeeze signal occurs when the more volatile BB moves inside the Keltner Channel and is a signal that a breakout from the Keltner Channel could soon occur. The Squeeze signal is usually used in conjunction with the Momentum indicator. The Momentum indicator gives the direction in which the breakout will occur. Our slope indicator when used with a period of 12 days is almost identical to the momentum indicator, but more graphical. The image to the left shows how you might use these indicators together, and below we show the resulting 6-month chart for AAPL.
More on the Squeeze Indicator
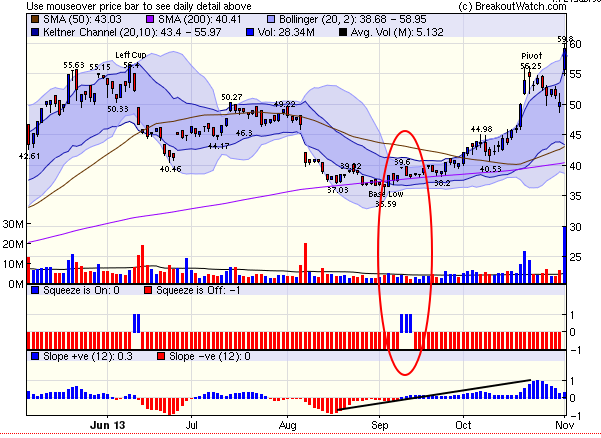
I just learned of this indicator this week and I'm looking forward to doing more research on it. If it can be combined with our other patterns, it may give another dimension to our ability to pick winning breakouts as they happen. In particular, it may enable us to pick winners while they are still low in their bases,
For example, FSLR was a recent strong breakout, from a classic CwH base. The squeeze indicator predicted the upward move while it was low in its base and that move turned out to be a gain of over 50%.
I invite you to look at charts of other breakouts and stocks on our current watchlists using these indicatora and let me know if you find them useful.
| Index | Value | Change Week | Change YTD | Trend | ||||||||||||||||||||||||||||||||||||
|---|---|---|---|---|---|---|---|---|---|---|---|---|---|---|---|---|---|---|---|---|---|---|---|---|---|---|---|---|---|---|---|---|---|---|---|---|---|---|---|---|
| Dow | 15615.5 | 0.29% | 19.16% | Up | ||||||||||||||||||||||||||||||||||||
| NASDAQ | 3922.04 | -0.54% | 29.89% | Up | ||||||||||||||||||||||||||||||||||||
| S&P 500 | 1761.64 | 0.11% | 23.52% | Up | ||||||||||||||||||||||||||||||||||||
1The Market Signal is derived
from our proprietary market model. The market model is
described on the site.
2The site also shows industry rankings based on fundamentals, combined technical and fundamentals, and on price alone. The site also shows daily industry movements. |
||||||||||||||||||||||||||||||||||||||||
|
# of Breakouts
|
Period Average1
|
Max. Gain During Period2
|
Gain at Period Close3
|
|
|---|---|---|---|---|
| This Week | 8 | 9.77 | 8.12% | 5.32% |
| Last Week | 6 | 10.23 | 12.02% | 6.71% |
| 13 Weeks | 126 | 10.85 | 18.8% |
5.68% |
2This represents the return if each stock were bought at its breakout price and sold at its intraday high.
3This represents the return if each stock were bought at its breakout price and sold at the most recent close.
|
Category
|
Symbol
|
Company Name
|
Expected Gain1
|
|---|---|---|---|
| Best Overall | PZZI | Pizza Inn, Inc. | 101 |
| Top Technical | PZZI | Pizza Inn, Inc. | 101 |
| Top Fundamental | BNCN | BNC Bancorp | 59 |
| Top Tech. & Fund. | EVC | Entravision Communication | 92 |
|
Category
|
Symbol
|
Company Name
|
Expected Gain1
|
|---|---|---|---|
| Best Overall | FLO | Flowers Foods, Inc. | 44 |
| Top Technical | X | United States Steel Corporation | 28 |
| Top Fundamental | FLO | Flowers Foods, Inc. | 44 |
| Top Tech. & Fund. | FLO | Flowers Foods, Inc. | 44 |
If you received this newsletter from a friend and you would like to receive it regularly please go to the BreakoutWatch.com site and enter as a Guest. You will then be able to register to receive the newsletter.
Copyright © 2013 NBIcharts, LLC dba BreakoutWatch.com. All rights
reserved.
" BreakoutWatch," the BreakoutWatch.com "eye" logo, and the slogan
"tomorrow's breakouts today" are service marks of NBIcharts LLC.
All other marks are the property of their respective owners, and
are used for descriptive purposes only.
BreakoutWatch is not affiliated with Investor's Business Daily or
with Mr. William O'Neil. Our site, research and analysis is
supported entirely by subscription and is free from advertising.