| Market Summary | Weekly Breakout Report | Top Breakout Choices | Top 2nd Chances | New Features | Tip of the Week |
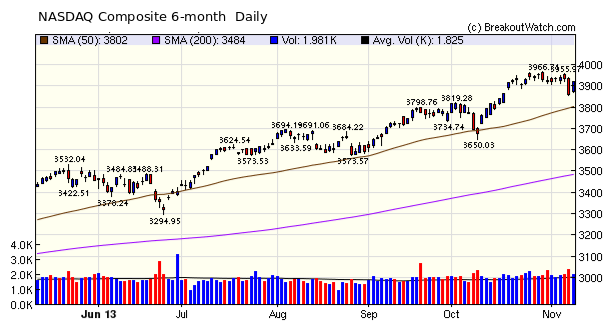
The NASDAQ Composite continues in consolidation mode with a slight downward bias but nothing to be alarmed about. The S&P 500 is also consolidating while the DJI is moving slowly higher. Our market trend signals all remain positive.
The number of breakouts rose to 12 this week with a health average gain of 4.2% by Friday's close. CUNE was the standout with a gain of 24% followed by NTLS, up 13%. It's only fair to mention the disappointments as well and CSUN closed 15 off its breakout price after surging to an intraday high of 15%.
More Squeeze Enhancements
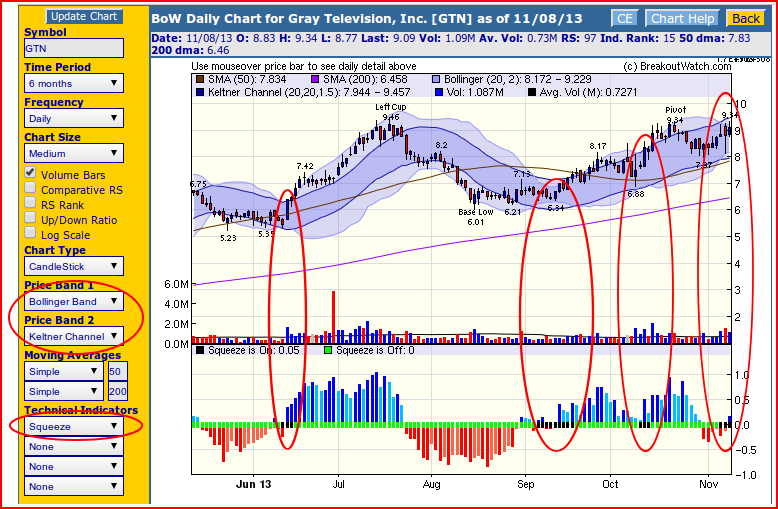
The Squeeze indicator has now been consolidated with momentum to provide a single chart. The image below shows GTN, a current entry on our CwH watchlist.
1. Squeeze Chart
A squeeze occurs when the Bollinger Band is completely enclosed within the Keltner channel, and this is indicated on the lower chart by black bars on the horizontal axis. You will notice that the squeeze is on currently in the handle for three days. The squeeze also occurred three times earlier in the six-month period shown and was each time followed by a healthy rise.
The squeeze indicators are overlayed on a normalized momentum chart. That is to say, that instead of using absolute momentum, momentum values are normalized within the range +/- 1. Positive momentum is represented by blue bars and negative momentum by red bars. A lighter shade of each shows a slight diminution in the momentum direction.
Charts with the squeeze indicator are presently only available from the BoWchart option in the top right hand side of the header., they are not currently available directly from a watchlist, although that will be added soon.
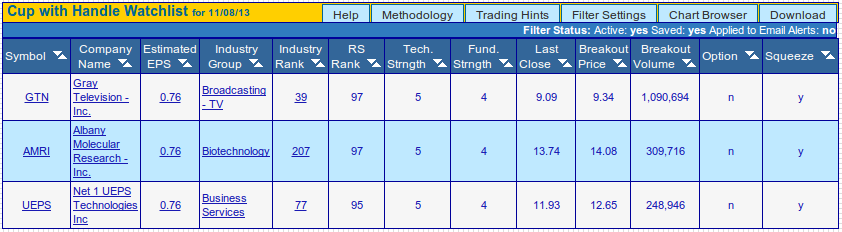
2. Squeeze Indicator on Watchlists
Watchlist stocks that are currently in a squeeze are now shown on each watchlist and the list can also be filtered to show only stocks that are in a squeeze. NB. Alerts can not yet be filtered for the squeeze indicator. The value of this is still to be determined.
3. Squeeze Filter Added to CwH Backtest
You can now do a CwH backtest using the squeeze filter but the filter has only been added to backtest data to the start of 2013.
Squeeze Interpretation
While the value of the squeeze is still to be determined, it is useful at this stage to define how the squeeze could be used to select long or short candidates.
- The squeeze should have been in place for at least three bars(days).
- A signal is only given when the squeeze is released. That is to say when the Bollinger Band again moves outside the Keltner Channel. This indicates that volatility has suddenly increased and indicating that a move is in place.
- A long position should only be entered if momentum is increasing and positive
- A short position should only be entered if momentum is negative and becoming more so.
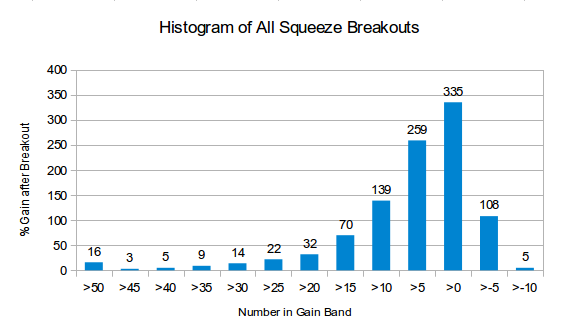
Despite these limitations, the results are encouraging:
- There were 1020 breakouts.
- Only 11% failed to improve on their breakout day close.
- The mean % gain was 9.1%.
- For comparison, the NASDAQ Composite gained 4.5% June 1 - July 31.
- The median % gain was 6%.
For an example of how these
results could be improved by filtering, I ran the same study by
select stocks with an RS rank >= 92. Again, there was no
filtering by price or volume.

These results show that further investigation is warranted to find the optimum combination of price, volume, fundamentals and technicals. I envisage a new watchlist of squeeze breakout candidates wil emerge from this work.
- There were 138 breakouts.
- Only 12% failed to improve on their breakout day close.
- The mean % gain was 12.8% ( a 40% improvement)
- For comparison, the NASDAQ Composite gained 4.5% June 1 -
July 31.
- The median % gain was 9% (a 50% improvement)
These results show that further investigation is warranted to find the optimum combination of price, volume, fundamentals and technicals. I envisage a new watchlist of squeeze breakout candidates wil emerge from this work.
| Index | Value | Change Week | Change YTD | Trend | ||||||||||||||||||||||||||||||||||||
|---|---|---|---|---|---|---|---|---|---|---|---|---|---|---|---|---|---|---|---|---|---|---|---|---|---|---|---|---|---|---|---|---|---|---|---|---|---|---|---|---|
| Dow | 15761.8 | 0.94% | 20.28% | Up | ||||||||||||||||||||||||||||||||||||
| NASDAQ | 3919.23 | -0.07% | 29.8% | Up | ||||||||||||||||||||||||||||||||||||
| S&P 500 | 1770.61 | 0.51% | 24.15% | Up | ||||||||||||||||||||||||||||||||||||
1The Market Signal is derived
from our proprietary market model. The market model is
described on the site.
2The site also shows industry rankings based on fundamentals, combined technical and fundamentals, and on price alone. The site also shows daily industry movements. |
||||||||||||||||||||||||||||||||||||||||
|
# of Breakouts
|
Period Average1
|
Max. Gain During Period2
|
Gain at Period Close3
|
|
|---|---|---|---|---|
| This Week | 12 | 10 | 9.55% | 4.17% |
| Last Week | 8 | 9.77 | 11.53% | 5.67% |
| 13 Weeks | 131 | 10.54 | 18.47% |
5.04% |
2This represents the return if each stock were bought at its breakout price and sold at its intraday high.
3This represents the return if each stock were bought at its breakout price and sold at the most recent close.
|
Category
|
Symbol
|
Company Name
|
Expected Gain1
|
|---|---|---|---|
| Best Overall | PZZI | Pizza Inn, Inc. | 101 |
| Top Technical | PZZI | Pizza Inn, Inc. | 101 |
| Top Fundamental | AFSI | Amtrust Financial Services, Inc. | 31 |
| Top Tech. & Fund. | HRG | Harbinger Group Inc | 65 |
|
Category
|
Symbol
|
Company Name
|
Expected Gain1
|
|---|---|---|---|
| Best Overall | XRM | Xerium Technologies, Inc. | 58 |
| Top Technical | XRM | Xerium Technologies, Inc. | 58 |
| Top Fundamental | HURN | Huron Consulting Group | 39 |
| Top Tech. & Fund. | HURN | Huron Consulting Group | 39 |
If you received this newsletter from a friend and you would like to receive it regularly please go to the BreakoutWatch.com site and enter as a Guest. You will then be able to register to receive the newsletter.
Copyright © 2013 NBIcharts, LLC dba BreakoutWatch.com. All rights
reserved.
" BreakoutWatch," the BreakoutWatch.com "eye" logo, and the slogan
"tomorrow's breakouts today" are service marks of NBIcharts LLC.
All other marks are the property of their respective owners, and
are used for descriptive purposes only.
BreakoutWatch is not affiliated with Investor's Business Daily or
with Mr. William O'Neil. Our site, research and analysis is
supported entirely by subscription and is free from advertising.