| Market Summary | Weekly Breakout Report | Top Breakout Choices | Top 2nd Chances | New Features | Tip of the Week |
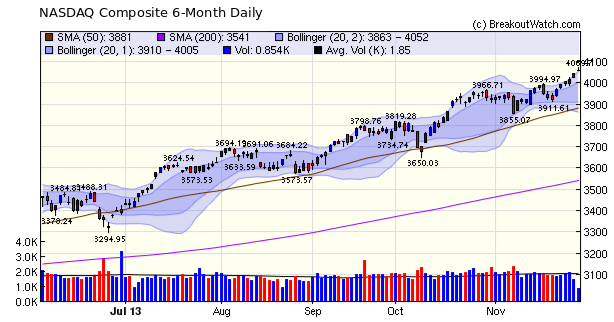
The shortened trading week saw volumes fall and consequently the number of breakouts also, as significantly increased volume is a pre-requisite for a confirmed breakout. Despite the lower volume, the NASDAQ made a very health 1.7% gain for the week in anticipation of on-line retailers making increased holiday sales.
November was a particularly strong month for breakouts from our cup-with-handle list with three stocks making over 50% gains.
- ONVO broke out on Nov. 6 and hit an intraday high 77% above its breakout price 12 days later. Profit taking followed but the stock is still up 15%
- GNE broke out on 11/15 and hit an intraday high 51% above the BoP. It is still showing a 46% profit.
- We mentioned UVE last week which hit a 50% intraday gain on Friday
There were many more strong breakouts during November. You can always see a list of breakouts in the last 90 days at menu choice Monitor > Recent Breakouts.
We hope you are enjoying a safe holiday weekend and are duly giving thanks for the goodies we brought you during November ;)
No new features this week.
This feature will return next week.
| Index | Value | Change Week | Change YTD | Trend | ||||||||||||||||||||||||||||||||||||
|---|---|---|---|---|---|---|---|---|---|---|---|---|---|---|---|---|---|---|---|---|---|---|---|---|---|---|---|---|---|---|---|---|---|---|---|---|---|---|---|---|
| Dow | 16086.4 | 0.13% | 22.76% | Up | ||||||||||||||||||||||||||||||||||||
| NASDAQ | 4059.89 | 1.71% | 34.46% | Up | ||||||||||||||||||||||||||||||||||||
| S&P 500 | 1805.81 | 0.06% | 26.62% | Up | ||||||||||||||||||||||||||||||||||||
1The Market Signal is derived
from our proprietary market model. The market model is
described on the site.
2The site also shows industry rankings based on fundamentals, combined technical and fundamentals, and on price alone. The site also shows daily industry movements. |
||||||||||||||||||||||||||||||||||||||||
|
# of Breakouts
|
Period Average1
|
Max. Gain During Period2
|
Gain at Period Close3
|
|
|---|---|---|---|---|
| This Week | 4 | 11.31 | 2.92% | -0.2% |
| Last Week | 9 | 11 | 11.41% | 9.5% |
| 13 Weeks | 145 | 11.62 | 20.18% |
8.89% |
2This represents the return if each stock were bought at its breakout price and sold at its intraday high.
3This represents the return if each stock were bought at its breakout price and sold at the most recent close.
|
Category
|
Symbol
|
Company Name
|
Expected Gain1
|
|---|---|---|---|
| Best Overall | PZZI | Pizza Inn, Inc. | 111 |
| Top Technical | PZZI | Pizza Inn, Inc. | 111 |
| Top Fundamental | AFSI | Amtrust Financial Services, Inc. | 44 |
| Top Tech. & Fund. | CSTE | Caesarstone Sdot-Yam Ltd | 60 |
|
Category
|
Symbol
|
Company Name
|
Expected Gain1
|
|---|---|---|---|
| Best Overall | HPQ | Hewlett-Packard Company | 48 |
| Top Technical | HPQ | Hewlett-Packard Company | 48 |
| Top Fundamental | BLMN | Bloomin' Brands Inc | 43 |
| Top Tech. & Fund. | BLMN | Bloomin' Brands Inc | 43 |
If you received this newsletter from a friend and you would like to receive it regularly please go to the BreakoutWatch.com site and enter as a Guest. You will then be able to register to receive the newsletter.
Copyright © 2013 NBIcharts, LLC dba BreakoutWatch.com. All rights
reserved.
" BreakoutWatch," the BreakoutWatch.com "eye" logo, and the slogan
"tomorrow's breakouts today" are service marks of NBIcharts LLC.
All other marks are the property of their respective owners, and
are used for descriptive purposes only.
BreakoutWatch is not affiliated with Investor's Business Daily or
with Mr. William O'Neil.
Our site, research and analysis is supported entirely by
subscription and is free from advertising.