| Market Summary | Weekly Breakout Report | Top Breakout Choices | Top 2nd Chances | New Features | Tip of the Week |
I'm back from vacation and looking forward to providing you with many successful and profitable breakouts in 2014. To start the year, I'm introducing a new watchlist which promises to be very profitable called "Squeeze Play". Read more about it below.
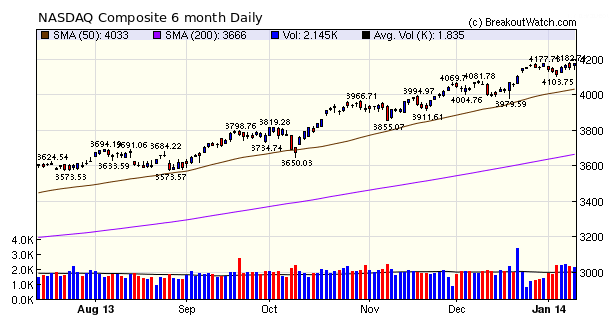
Although the major indexes got off to a shaky start, at least the NASDAQ has recovered, and all trend indicators remain positive. This week brought some strong breakouts. In the last two days, we've seen ITMN gain 17.6%, FPRX gain 10% and PRCP gain 14.5%.
There were several outstanding breakouts over the holiday period. TNXP broke out from an HTF pattern on December 26 and has gained 67%. CCIH has gained 43% since breaking out from a CWH pattern on January 3. Also on January 3, FLML broke out from a CWH and has since gained 30%.
Squeeze Play
We have added a new watchlist of stocks that forming the right side of a cup and are also in a squeeze. We call the new watchlist "Squeeze Play" and it is accessed from the Mine for Candidates > Long Positions > Squeeze Play menu choice. The watchlist is described in more detail below.
Intraday Charts
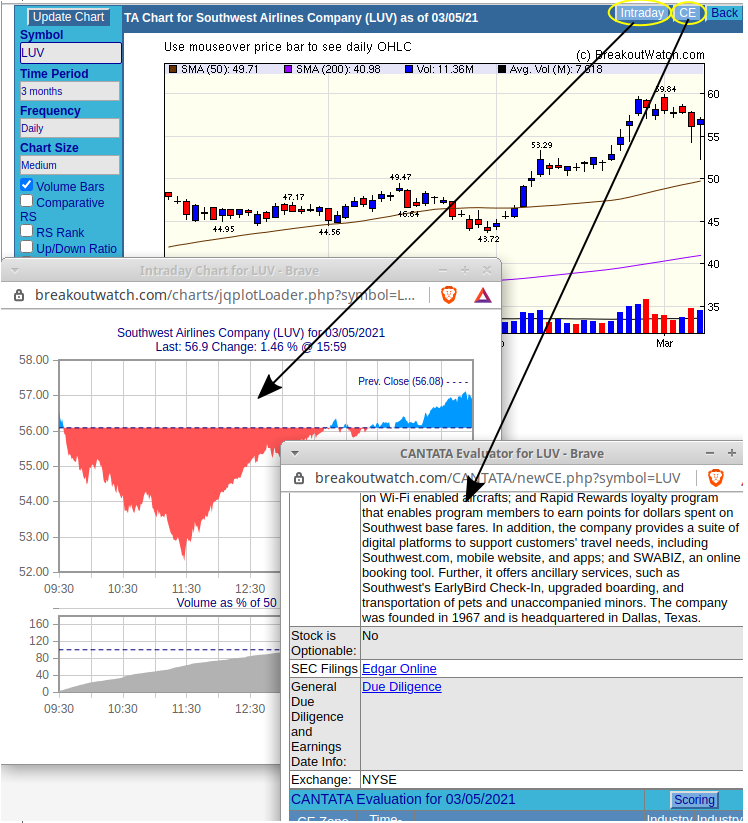
Intraday charts on any stock are now available when you select a BoWChart from the top right hand corner of the page. After the main chart loads, there is an intraday button in the top right of the chart window.
What is a Squeeze
A "squeeze" occurs when the volatility of a stock falls to below its recent levels. A fall in volatility usually means that the stock is in a period of consolidation or trending in a narrow range. When that period ends normal volatility will return resulting in a breakout to the upside or downside.
We detect a "squeeze" when the 2 standard deviation Bollinger Band (BB) narrows to within the Keltner Channel (KC). Bollinger Bands are very susceptible to volatility changes while Keltner Channels are a smoother, trend following, indicator. Consequently, the narrowing of the BB to within the KC gives us a convenient means of algorithmically recognizing a drop in volatility.
While the BB are within the KC, we say the "squeeze is on". For trading purposes, we are interested in the moment when the squeeze comes off, meaning that the upper and lower BB move outside the KC again, which signals a breakout. Of course, the breakout can be to the upside or downside, but for our Squeeze watchlist we are interested only in breakouts to the upside.
A squeeze can occur while a stock is trending up or down. For our squeeze watchlist, we are only concerned with stocks trending up.
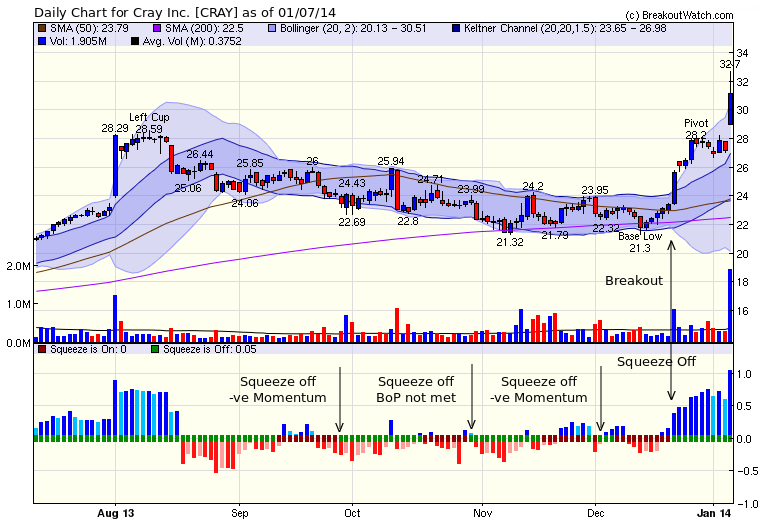
This graphic shows four possible situations in which a squeeze can occur and then come off. In scenarios A, B and C, CRAY would not have appeared on the SQZ watchlist because it was not ascending the right side of a cup, nevertheless A, B and C illustrate the circumstances under which a squeeze can occur. In scenario D, CRAY would have been on the watchlist and an alert would have been issued.
Selecting Stocks for Our Squeeze Watchlist
When we select stocks for our cup-with-Handle (CwH), Double Bottom (DB) or Head and Shoulders Bottom (HSB) patterns, we first look for stocks that have formed the left side of a cup and are starting to ascend the right side. This behavior is common to all three patterns and we place these stocks on an internal watchlist we call Basewatch. To select stocks for the Squeeze (SQZ) watchlist, our algorithms examine each stock on Basewatch to determine if the squeeze is on for each stock. To remove the likelihood that the stock could breakdown from the squeeze we also look at the momentum of the stock and the slope of the momentum curve. If both momentum and the slope of the momentum curve are positive, then these stocks go on the SQZ watchlist.
Determining Breakout Price
For the squeeze to come off and give a buy signal, the upper BB value must be above the upper KC
value. So while in a squeeze we can calculate the price at which the stock must close at the next session to lift the upper BB above the upper KC. This price now becomes the breakout price.
Squeeze Alerts
As with our other watchlists, we monitor the real-time price during the next session and issue an alert if the breakout price is reached.
| Index | Value | Change Week | Change YTD | Trend | ||||||||||||||||||||||||||||||||||||
|---|---|---|---|---|---|---|---|---|---|---|---|---|---|---|---|---|---|---|---|---|---|---|---|---|---|---|---|---|---|---|---|---|---|---|---|---|---|---|---|---|
| Dow | 16437.1 | -0.2% | -0.84% | Up | ||||||||||||||||||||||||||||||||||||
| NASDAQ | 4174.67 | 1.03% | -0.05% | Up | ||||||||||||||||||||||||||||||||||||
| S&P 500 | 1842.37 | 0.6% | -0.32% | Up | ||||||||||||||||||||||||||||||||||||
1The Market Signal is derived
from our proprietary market model. The market model is
described on the site.
2The site also shows industry rankings based on fundamentals, combined technical and fundamentals, and on price alone. The site also shows daily industry movements. |
||||||||||||||||||||||||||||||||||||||||
|
# of Breakouts
|
Period Average1
|
Max. Gain During Period2
|
Gain at Period Close3
|
|
|---|---|---|---|---|
| This Week | 19 | 10.15 | 22.27% | 9.08% |
| Last Week | 10 | 9.15 | 86.35% | 59.79% |
| 13 Weeks | 127 | 11 | 46.37% |
15.84% |
2This represents the return if each stock were bought at its breakout price and sold at its intraday high.
3This represents the return if each stock were bought at its breakout price and sold at the most recent close.
|
Category
|
Symbol
|
Company Name
|
Expected Gain1
|
|---|---|---|---|
| Best Overall | SPCB | Supercom Ltd | 114 |
| Top Technical | SPCB | Supercom Ltd | 114 |
| Top Fundamental | SBGI | Sinclair Broadcast Group, Inc. | 50 |
| Top Tech. & Fund. | SBGI | Sinclair Broadcast Group, Inc. | 50 |
|
Category
|
Symbol
|
Company Name
|
Expected Gain1
|
|---|---|---|---|
| Best Overall | KCG | KCG Holdings, Inc. Class A Common Stock When Issue | 67 |
| Top Technical | KCG | KCG Holdings, Inc. Class A Common Stock When Issue | 67 |
| Top Fundamental | CORE | Core-Mark Holding Company, Inc. | 0 |
| Top Tech. & Fund. | CORE | Core-Mark Holding Company, Inc. | 0 |
If you received this newsletter from a friend and you would like to receive it regularly please go to the BreakoutWatch.com site and enter as a Guest. You will then be able to register to receive the newsletter.
Copyright © 2014 NBIcharts, LLC dba BreakoutWatch.com. All rights
reserved.
" BreakoutWatch," the BreakoutWatch.com "eye" logo, and the slogan
"tomorrow's breakouts today" are service marks of NBIcharts LLC.
All other marks are the property of their respective owners, and
are used for descriptive purposes only.
BreakoutWatch is not affiliated with Investor's Business Daily or
with Mr. William O'Neil.
Our site, research and analysis is supported entirely by
subscription and is free from advertising.