| Market Summary | Weekly Breakout Report | Top Breakout Choices | Top 2nd Chances | New Features | Tip of the Week |
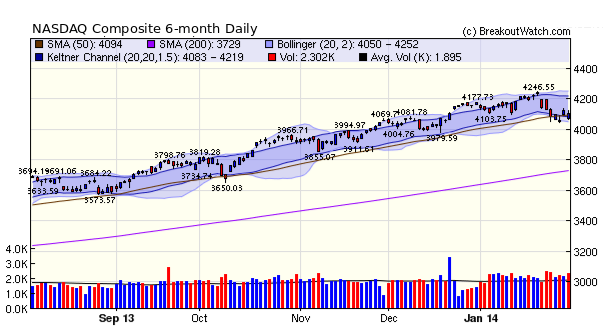
Our market rend signal for the NASDAQ turned down on Wednesday. The index recovered on Friday to close slightly above the 50 day average. Although this is a time for caution, I continue to believe this is a consolidation, not a correction, and the markets will recover as the economy improves.
Despite the downturn there were 21 breakouts this week, which included 7 from our new "Squeeze Play" watchlist. The top performer was ORBC which broke out from a CWH pattern with squeeze and hit an intraday gain of 19%. The best "Squeeze Play" performer was PRTA with a 9.8% intraday gain. There is more below about Squeeze play.
Results for 'Squeeze Play" breakouts are now included in our Recent Breakouts report. AS you will see below, we are considering a breakout from this watchlist to be a successful breakout if it closes above the 'trigger' price and also exceeds 150% of 50 day average volume.
Squeeze Play Backtest Results
I have continued my analysis of the "Squeeze Play" watchlist and attempted to identify when alerts from this list have the most value.
Using my extensive historical database, I looked at all the situations since January, 2008 (so as to include the crash) where a stock would have qualified for the Squeeze Play watchlist and an alert would have been issued*. I found that in 56% of cases, the stock closed above the trigger price**.
Delving further, I found that the probability of the stock closing above the alert price increased as volume for that day exceeded the 50 day average volume. The table below shows the number of alerts that would have been issued at each volume level and the number that would have been considered successful. You can see that at a volume ratio of 1.5 the number of successes rises to 66%, which is consistent with the success rate for CwH breakouts. I am now considering a SQZ breakout to be successful if the breakout day volum eexceeds 150%.
The table also shows the average gain for the days following the breakout day (day 0) and the 6 days following.
| Volume Ratio |
# Alerts | # Success | Success % | Average % Gain for each day after breakout | ||||||
|---|---|---|---|---|---|---|---|---|---|---|
| 0 | 1 | 2 | 3 | 4 | 5 | 6 | ||||
| 1 | 1552 | 927 | 60 | 1.57 | 1.72 | 1.84 | 1.84 | 1.85 | 1.99 | 2.17 |
| 1.1 | 1350 | 811 | 60 | 1.65 | 1.84 | 2.01 | 2 | 2.01 | 2.17 | 2.38 |
| 1.2 | 1162 | 719 | 62 | 1.7 | 1.85 | 2.01 | 1.98 | 1.98 | 2.08 | 2.33 |
| 1.3 | 1015 | 642 | 63 | 1.77 | 1.9 | 2.06 | 2.06 | 2.04 | 2.17 | 2.42 |
| 1.4 | 884 | 577 | 65 | 1.82 | 1.93 | 2.1 | 2.09 | 2.03 | 2.18 | 2.5 |
| 1.5 | 776 | 509 | 66 | 1.88 | 1.95 | 2.15 | 2.16 | 2.08 | 2.18 | 2.48 |
| 1.6 | 677 | 445 | 66 | 1.96 | 2.02 | 2.25 | 2.33 | 2.22 | 2.31 | 2.59 |
| 1.7 | 579 | 391 | 68 | 2 | 2.06 | 2.35 | 2.46 | 2.39 | 2.41 | 2.69 |
| 1.8 | 496 | 335 | 68 | 2.07 | 2.04 | 2.29 | 2.39 | 2.3 | 2.2 | 2.63 |
| 1.9 | 431 | 290 | 67 | 2.15 | 2.1 | 2.29 | 2.19 | 2.07 | 2.04 | 2.45 |
| 2 | 390 | 265 | 68 | 2.15 | 2.15 | 2.4 | 2.23 | 2.12 | 2.16 | 2.58 |
| 2.1 | 344 | 235 | 68 | 2.18 | 2.12 | 2.39 | 2.25 | 2.19 | 2.25 | 2.74 |
| 2.2 | 317 | 218 | 69 | 2.24 | 2.07 | 2.22 | 2.1 | 2.09 | 2.07 | 2.59 |
| 2.3 | 286 | 197 | 69 | 2.3 | 2.18 | 2.35 | 2.32 | 2.23 | 2.23 | 2.7 |
| 2.4 | 249 | 173 | 69 | 2.35 | 2.2 | 2.44 | 2.32 | 2.12 | 2.02 | 2.28 |
| 2.5 | 230 | 155 | 67 | 2.35 | 2.19 | 2.42 | 2.31 | 2.11 | 1.82 | 2.23 |
| 2.6 | 209 | 144 | 69 | 2.39 | 2.27 | 2.55 | 2.43 | 2.23 | 1.95 | 2.3 |
| 2.7 | 187 | 130 | 70 | 2.38 | 2.23 | 2.52 | 2.4 | 2.25 | 1.91 | 2.3 |
| 2.8 | 172 | 121 | 70 | 2.42 | 2.24 | 2.61 | 2.38 | 2.14 | 1.92 | 2.31 |
| 2.9 | 159 | 115 | 72 | 2.45 | 2.18 | 2.57 | 2.43 | 2.12 | 1.88 | 2.25 |
Conclusion
Alerts from the "Squeeze Play" watchlist will be profitable if they can be bought at the trigger price 56% of the time. The success rate rises as volume rises, so when an alert is issued, an intraday chart should be viewed and the volume level at alert time checked. If it looks as though volume will be significant for the day, then the trade can be entered.
I have not yet analyzed the effect of buying at the next day's close if a SQZ breakout is confirmed. I hope to do that by next weeks newsletter.
*That is, the stock was ascending the right side of a cup, A squeeze situation was on, momentum was positive, and momentum was increasing and an alert would have been issued on the following day.
** The trigger price is the price needed to move the upper Bollinger Band outside the upper Keltner Channel meaning that the squeeze would end.
| Index | Value | Change Week | Change YTD | Trend | ||||||||||||||||||||||||||||||||||||
|---|---|---|---|---|---|---|---|---|---|---|---|---|---|---|---|---|---|---|---|---|---|---|---|---|---|---|---|---|---|---|---|---|---|---|---|---|---|---|---|---|
| Dow | 15698.8 | -1.14% | -5.3% | Down | ||||||||||||||||||||||||||||||||||||
| NASDAQ | 4103.88 | -0.59% | -1.74% | Down | ||||||||||||||||||||||||||||||||||||
| S&P 500 | 1782.59 | -0.43% | -3.56% | Down | ||||||||||||||||||||||||||||||||||||
1The Market Signal is derived
from our proprietary market model. The market model is
described on the site.
2The site also shows industry rankings based on fundamentals, combined technical and fundamentals, and on price alone. The site also shows daily industry movements. |
||||||||||||||||||||||||||||||||||||||||
|
# of Breakouts
|
Period Average1
|
Max. Gain During Period2
|
Gain at Period Close3
|
|
|---|---|---|---|---|
| This Week | 21 | 9.77 | 21.99% | 1.14% |
| Last Week | 6 | 9.46 | 3.88% | -5.47% |
| 13 Weeks | 125 | 10.38 | 20.37% |
4.8% |
2This represents the return if each stock were bought at its breakout price and sold at its intraday high.
3This represents the return if each stock were bought at its breakout price and sold at the most recent close.
|
Category
|
Symbol
|
Company Name
|
Expected Gain1
|
|---|---|---|---|
| Best Overall | YGE | Yingli Green Energy Holding Company Limited | 103 |
| Top Technical | YGE | Yingli Green Energy Holding Company Limited | 103 |
| Top Fundamental | PCLN | Priceline.com Inc | 26 |
| Top Tech. & Fund. | PCLN | Priceline.com Inc | 26 |
|
Category
|
Symbol
|
Company Name
|
Expected Gain1
|
|---|---|---|---|
| Best Overall | ORBC | ORBCOMM Inc | 112 |
| Top Technical | ININ | Interactive Intelligence Group Inc | 33 |
| Top Fundamental | QCOR | Questcor Pharmaceuticals Inc | 50 |
| Top Tech. & Fund. | QCOR | Questcor Pharmaceuticals Inc | 50 |
If you received this newsletter from a friend and you would like to receive it regularly please go to the BreakoutWatch.com site and enter as a Guest. You will then be able to register to receive the newsletter.
Copyright © 2014 NBIcharts, LLC dba BreakoutWatch.com. All rights
reserved.
" BreakoutWatch," the BreakoutWatch.com "eye" logo, and the slogan
"tomorrow's breakouts today" are service marks of NBIcharts LLC.
All other marks are the property of their respective owners, and
are used for descriptive purposes only.
BreakoutWatch is not affiliated with Investor's Business Daily or
with Mr. William O'Neil. Our site, research and analysis is
supported entirely by subscription and is free from advertising.