| Market Summary | Weekly Breakout Report | Top Breakout Choices | Top 2nd Chances | New Features | Tip of the Week |
The NASDAQ continues to set new highs and generates strong breakouts as it does so. 8 out of the top 10 breakouts this week (see below) were NASDAQ listings. This is fairly typical and why in this section of the newsletter we focus on the NASDAQ Composite index.
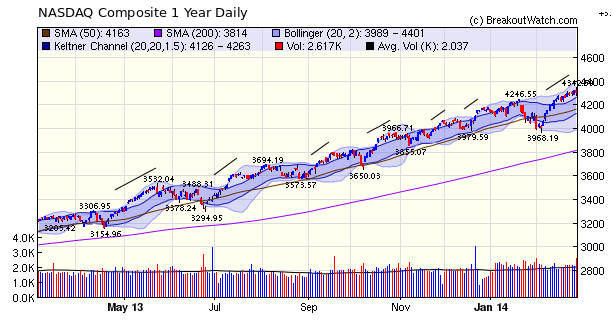
A 1 year chart shows that the index will soon begin a consolidation of the gains of the last three weeks, although a few more days of gains are possible. The chart below shows the Keltner Channel (darker blue) overlaid with the Bollinger Band (lighter) blue. Notice how whenever the candlesticks move above the Keltner channel and touch the Bollinger Band a consolidation soon begins. As of Friday we are mid-way between the upper Keltner Channel and Bollinger Band and that is why I say a few more days of gains are possible.
Notice also that 7 out of the top ten came from our new "Squeeze Play" watchlist.
| Breakouts for Week Beginning 02/24/14 | ||||||||
| Brkout Date | Symbol | Base | Squeeze | BrkoutOut Price | Brkout Day Close | Last Close | Current % off BOP | Gain at Intraday High |
|---|---|---|---|---|---|---|---|---|
| 02/24/14 | FNP | CwH | N | 31.31 | 31.46 | 34.22 | 9.29 | 13.51 |
| 02/25/14 | HPTX | SQZ | Y | 28.11 | 31.41 | 31 | 10.28 | 13.38 |
| 02/25/14 | STCK | SQZ | Y | 19.77 | 20.8 | 22.26 | 12.59 | 12.59 |
| 02/24/14 | JOSB | SQZ | Y | 55.85 | 60.04 | 62.08 | 11.15 | 11.15 |
| 02/24/14 | XOMA | SQZ | Y | 8.58 | 8.85 | 8.36 | -2.56 | 11.07 |
| 02/25/14 | SCTY | SQZ | Y | 78.65 | 81.18 | 84.96 | 8.02 | 9.52 |
| 02/25/14 | FEYE | HTF | N | 79.92 | 80.00 | 85.64 | 7.16 | 8.9 |
| 02/27/14 | VE | CwH | N | 17.79 | 18.89 | 18.98 | 6.69 | 6.69 |
| 02/24/14 | NVFY | SQZ | Y | 7.36 | 7.81 | 7.26 | -1.36 | 6.11 |
| 02/27/14 | SRNE | SQZ | Y | 10.87 | 11.52 | 11.52 | 5.98 | 5.98 |
| 02/24/14 | SEV | HTF | N | 13.13 | 13.88 | 11.25 | -14.32 | 5.71 |
| 02/26/14 | OCRX | SQZ | Y | 15.06 | 15.7 | 15.46 | 2.66 | 4.25 |
| 02/25/14 | FORM | SQZ | Y | 6.91 | 6.94 | 7.13 | 3.18 | 4.05 |
| 02/27/14 | SNAK | CwH | N | 13.45 | 13.75 | 13.89 | 3.27 | 3.27 |
| 02/28/14 | HEES | SQZ | Y | 31.83 | 32.72 | 32.72 | 2.80 | 2.8 |
| 02/27/14 | OILT | CwH | Y | 67.47 | 68.51 | 69.21 | 2.58 | 2.58 |
| 02/26/14 | BAH | CwH | N | 20.52 | 20.52 | 21.03 | 2.49 | 2.49 |
| 02/26/14 | ADHD | SQZ | Y | 24.46 | 25.02 | 23.81 | -2.66 | 2.29 |
| 02/26/14 | PPC | CwH | Y | 17.16 | 17.36 | 17.53 | 2.16 | 2.16 |
| 02/28/14 | EVC | SQZ | Y | 6.53 | 6.63 | 6.63 | 1.53 | 1.53 |
| 02/24/14 | ECYT | CwH | N | 15.64 | 15.65 | 13.17 | -15.79 | 0.64 |
| 02/28/14 | VLCCF | CwH | Y | 10.32 | 10.36 | 10.36 | 0.39 | 0.39 |
| 02/28/14 | PSIX | CwH | N | 73.87 | 74.10 | 74.1 | 0.31 | 0.31 |
The "Squeeze Off" price (SOP) will be shown on cup-with-handle breakout alerts starting on Monday. Alerts will continue to be issued when the breakout price (BOP) is met so if you wish to wait for the SOP you will have to monitor the stock yourself following the breakout alert. This is discussed further below.
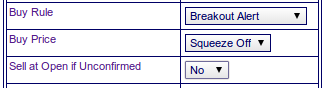
Our CwH Backtest tool now includes an option to trade at the "Squeeze Off" price. Set the Buy Rule and BuyPrice as shown.
Trading CwH Alerts at Squeeze Off Price
You will recall from last week's newsletter that breakouts from a cup-with-handle pattern are more likely to be confirmed if the intraday price matches or exceeds the normal CwH breakout price (pivot). However, the Squeeze Off price (SOP) is usually (not always) above the pivot, so if you wait for the SOP you will give up a little of your potential profit. Also, breakouts coinciding with the SOP are rarer, so your opportunities for profits are diminished.
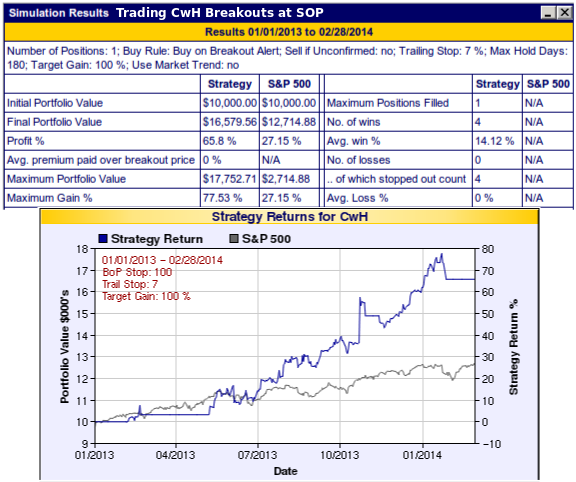
Note also that there is no recommended minimum RS Rank, volume, Industry Rank or market trend requirement to trade the CwH alerts at the SOP price. My suggestion is once the position is open, hold it until it breaches a 7% trailing stop.
Our backtest data shows that under these conditions, since January 1, 2013 you would have traded just 4 position for an average profit of 14% with no losses and an overall gain of 65%.
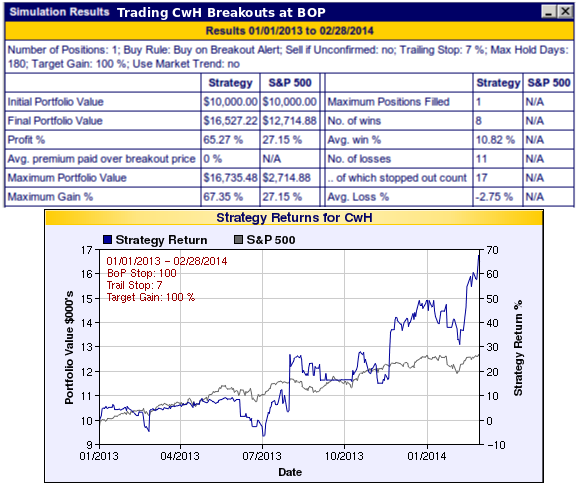
In contrast, if you traded CwH breakouts on BoP under the same conditions (that is with no minimums or market trend requirement) you would have had a similar return but with 8 wins and 11 losses for an average gain of 10.8%.
Conclusion
Trading CwH breakouts when they reach the Squeeze Off price gives fewer, lower risk trades, which may be attractive to more risk-averse traders. For the more adventurous, I still recommend trading CwH alerts using the default parameters shown on the CwH backtest page.
| Index | Value | Change Week | Change YTD | Trend | ||||||||||||||||||||||||||||||||||||
|---|---|---|---|---|---|---|---|---|---|---|---|---|---|---|---|---|---|---|---|---|---|---|---|---|---|---|---|---|---|---|---|---|---|---|---|---|---|---|---|---|
| Dow | 16321.7 | 1.36% | -1.54% | Up | ||||||||||||||||||||||||||||||||||||
| NASDAQ | 4308.12 | 1.05% | 3.15% | Up | ||||||||||||||||||||||||||||||||||||
| S&P 500 | 1859.45 | 1.26% | 0.6% | Up | ||||||||||||||||||||||||||||||||||||
1The Market Signal is derived
from our proprietary market model. The market model is
described on the site.
2The site also shows industry rankings based on fundamentals, combined technical and fundamentals, and on price alone. The site also shows daily industry movements. |
||||||||||||||||||||||||||||||||||||||||
|
Category
|
Symbol
|
Company Name
|
Expected Gain1
|
|---|---|---|---|
| Best Overall | CERS | Cerus Corporation | 101 |
| Top Technical | CERS | Cerus Corporation | 101 |
| Top Fundamental | TIS | Orchids Paper Products Company | 34 |
| Top Tech. & Fund. | UIHC | United Insurance Holdings Corp. | 66 |
|
Category
|
Symbol
|
Company Name
|
Expected Gain1
|
|---|---|---|---|
| Best Overall | VLCCF | Knightsbridge Tankers Limited | 77 |
| Top Technical | OILT | Oiltanking Partners, L.P. | 39 |
| Top Fundamental | OILT | Oiltanking Partners, L.P. | 39 |
| Top Tech. & Fund. | OILT | Oiltanking Partners, L.P. | 39 |
If you received this newsletter from a friend and you would like to receive it regularly please go to the BreakoutWatch.com site and enter as a Guest. You will then be able to register to receive the newsletter.
Copyright © 2014 NBIcharts, LLC dba BreakoutWatch.com. All rights
reserved.
" BreakoutWatch," the BreakoutWatch.com "eye" logo, and the slogan
"tomorrow's breakouts today" are service marks of NBIcharts LLC.
All other marks are the property of their respective owners, and
are used for descriptive purposes only.
BreakoutWatch is not affiliated with Investor's Business Daily or
with Mr. William O'Neil. Our site, research and analysis is
supported entirely by subscription and is free from advertising.