| Market Summary | Weekly Breakout Report | Top Breakout Choices | Top 2nd Chances | New Features | Tip of the Week |
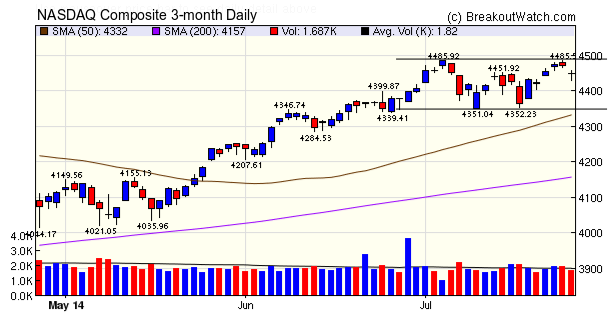
The NASDAQ Composite is trading in a flat base pattern. After attempting to break resistance on Thursday the index pulled back on Friday in response to disappointing earnings and fears new sanctions on Russia would inhibit growth. Friday's Doji pattern indicates indecision as to the next move with a slight bias towards the upside.
The number of breakouts slipped slightly to 22 from last week's 26. Breakouts from the SqueezePlay watchlist formed the majority of breakouts. As a reminder, the SqueezePlay watchlist is drawn from stocks ascending the right side of a cup but do not qualify for the cup and handle watchlist.
| Breakouts for Week Beginning 07/21/14 | ||||||||
| Brkout Date | Symbol | Base | Squeeze | BrkoutOut Price | Brkout Day Close | Last Close | Current % off BOP | Gain at Intraday High |
|---|---|---|---|---|---|---|---|---|
| 07/24/14 | UA | SQZ | Y | 60.73 | 69.55 | 69.11 | 13.80 | 14.52 |
| 07/22/14 | YINN | CwH | N | 29.53 | 30.73 | 33.44 | 13.24 | 13.24 |
| 07/23/14 | CCM | CwH | N | 8.56 | 9.39 | 8 | -6.54 | 9.7 |
| 07/21/14 | ZINC | CwH | N | 18.91 | 19.54 | 19.55 | 3.38 | 9.47 |
| 07/21/14 | PXLW | CwH | N | 8.79 | 9.14 | 8.32 | -5.35 | 8.19 |
| 07/22/14 | CDZI | SQZ | Y | 8.84 | 9.33 | 9.35 | 5.77 | 5.77 |
| 07/24/14 | NOK | SQZ | Y | 7.88 | 8.32 | 8.24 | 4.57 | 5.58 |
| 07/21/14 | TMO | SQZ | Y | 121.10 | 122.14 | 125.07 | 3.28 | 3.64 |
| 07/21/14 | IEP | SQZ | Y | 103.25 | 103.33 | 105.87 | 2.54 | 3.51 |
| 07/24/14 | WAB | CwH | N | 83.86 | 86.18 | 85.46 | 1.91 | 2.77 |
| 07/24/14 | ABC | SQZ | Y | 74.76 | 76.37 | 76.79 | 2.72 | 2.72 |
| 07/21/14 | ONNN | SQZ | Y | 9.44 | 9.44 | 8.66 | -8.26 | 2.12 |
| 07/23/14 | RUSHA | CwH | N | 35.27 | 35.85 | 35.7 | 1.22 | 1.64 |
| 07/23/14 | HNP | CwH | N | 48.50 | 48.91 | 48.61 | 0.23 | 0.85 |
| 07/24/14 | SBUX | SQZ | Y | 79.84 | 80.45 | 78.74 | -1.38 | 0.76 |
| 07/24/14 | PRLB | CwH | N | 85.90 | 86.51 | 84.49 | -1.64 | 0.71 |
| 07/25/14 | XRX | CwH | N | 13.06 | 13.15 | 13.15 | 0.69 | 0.69 |
| 07/21/14 | IDIX | HTF | N | 24.17 | 24.28 | 24.33 | 0.66 | 0.66 |
| 07/22/14 | SLG | SQZ | Y | 111.16 | 111.72 | 109.75 | -1.27 | 0.63 |
| 07/24/14 | VNO | SQZ | Y | 108.42 | 108.6 | 107.34 | -1.00 | 0.17 |
| 07/24/14 | CVGW | SQZ | Y | 34.79 | 34.81 | 34.85 | 0.17 | 0.17 |
| 07/24/14 | MAA | SQZ | Y | 74.30 | 74.38 | 74.2 | -0.13 | 0.11 |
| Weekly Average (22 breakouts) | 1.3 | 3.98 | ||||||
Historical Volatility
A knowledge of historical volatility (HV) is important when judging if an option is fairly priced. We've added a HV chart showing HV as calculated by the ThinkorSwim (TOS) trading platform.
The Historical Volatility study calculates volatility which can be expressed by the following formula:

where
c is a coefficient depending on the volatility basis and m is average of logarithmic return xi which, in turn, is calculated as follows:

Think or Swim use a value of 20 for the coefficient c and so do we.
If you are interested in trading options from the cup and handle or SqueezePlay watchlists, you will find this chart invaluable. It is accessed from the Technical Indicator chart menu:
Historical Volatility for Options Trading
Last week we described why the squeeze and cup with handle combination can lead to profitable trades for both stocks and options. We also mentioned that the historical volatility measure used in trading options is different from the formula used by Bollinger Bands (BB). In fact, the difference is the log term in the formula above. BB's calculate the standard deviation of consecutive closing prices but historical volatility is calculated from the standard deviation of the log of consecutive closing prices.
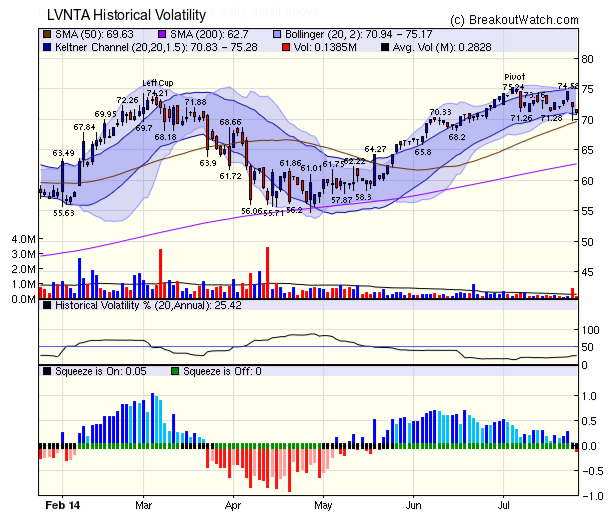
The chart below shows the Historical Volatility for LVNTA which is on the CwH list and met our squeeze criteria on Thursday (Momentum turned negative and Friday and so it no longer meets the criteria - squeeze chart). The latest HV value is 25.42. This value can now be compared to the Implied Volatility (IV) of the available options. At the time of writing, TOS gives the IV of the August $70 strike price (the closest in-the-money option to the $71.06 Friday close) as 32.6%. This means that an increase in volatility is already built into the bid/ask price of this option.
A breakout will increase the historical volatility and it is up to the option trader to judge whether the likely increase in volatility exceeds the IV built into the trade. It is beyond the scope of this article to explain the complex nuances involved, but I refer you to The Volatility Edge in Options Trading by Jeff Augen for the details.
| Index | Value | Change Week | Change YTD | Trend | ||||||||||||||||||||||||||||||||||||
|---|---|---|---|---|---|---|---|---|---|---|---|---|---|---|---|---|---|---|---|---|---|---|---|---|---|---|---|---|---|---|---|---|---|---|---|---|---|---|---|---|
| Dow | 16960.6 | -0.82% | 2.32% | Up | ||||||||||||||||||||||||||||||||||||
| NASDAQ | 4449.56 | 0.39% | 6.54% | Up | ||||||||||||||||||||||||||||||||||||
| S&P 500 | 1978.34 | 0.01% | 7.03% | Up | ||||||||||||||||||||||||||||||||||||
1The Market Signal is derived
from our proprietary market model. The market model is
described on the site.
2The site also shows industry rankings based on fundamentals, combined technical and fundamentals, and on price alone. The site also shows daily industry movements. |
||||||||||||||||||||||||||||||||||||||||
|
Category
|
Symbol
|
Company Name
|
Expected Gain1
|
|---|---|---|---|
| Best Overall | PZE | Petrobras Argentina S.A. | 106 |
| Top Technical | PZE | Petrobras Argentina S.A. | 106 |
| Top Fundamental | MEOH | Methanex Corporation | 34 |
| Top Tech. & Fund. | HAR | Harman International Industries, Incorporated | 34 |
|
Category
|
Symbol
|
Company Name
|
Expected Gain1
|
|---|---|---|---|
| Best Overall | PXLW | Pixelworks, Inc. | 93 |
| Top Technical | PXLW | Pixelworks, Inc. | 93 |
| Top Fundamental | PRLB | Proto Labs, Inc. | 37 |
| Top Tech. & Fund. | PRLB | Proto Labs, Inc. | 37 |
If you received this newsletter from a friend and you would like to receive it regularly please go to the BreakoutWatch.com site and enter as a Guest. You will then be able to register to receive the newsletter.
Copyright © 2014 NBIcharts, LLC dba BreakoutWatch.com. All rights
reserved.
" BreakoutWatch," the BreakoutWatch.com "eye" logo, and the slogan
"tomorrow's breakouts today" are service marks of NBIcharts LLC.
All other marks are the property of their respective owners, and
are used for descriptive purposes only.
BreakoutWatch is not affiliated with Investor's Business Daily or
with Mr. William O'Neil. Our site, research and analysis is
supported entirely by subscription and is free from advertising.