| Market Summary | Weekly Breakout Report | Top Breakout Choices | Top 2nd Chances | New Features | Tip of the Week |
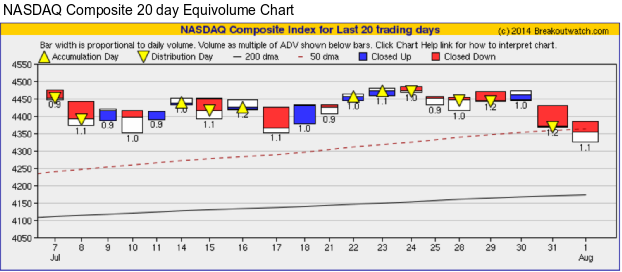
Our equivolume chart of the NASDAQ shows three distribution days this week. An early rally on Friday in response to positive employment data failed to hold but buyers entered the market in the afternoon as the index fell below its 50 day average. The index closed above its lows for the day although still below the 50 day average.
With the markets in retreat, the number of breakouts fell from 22 last week to 16.
| Breakouts for Week Beginning 07/28/14 | ||||||||
| Brkout Date | Symbol | Base | Squeeze | BrkoutOut Price | Brkout Day Close | Last Close | Current % off BOP | Gain at Intraday High |
|---|---|---|---|---|---|---|---|---|
| 07/30/14 | ICLR | CwH | Y | 48.50 | 52.11 | 51.6 | 6.39 | 7.44 |
| 07/30/14 | HPY | CwH | N | 46.45 | 49.38 | 47.51 | 2.28 | 6.31 |
| 07/28/14 | JKS | HSB | N | 26.49 | 27.51 | 23.93 | -9.66 | 3.85 |
| 07/29/14 | MSTR | SQZ | Y | 145.23 | 150.37 | 140.21 | -3.46 | 3.54 |
| 07/29/14 | PEGA | CwH | Y | 22.05 | 22.51 | 20.87 | -5.35 | 3.4 |
| 07/30/14 | PEIX | CwH | N | 18.56 | 18.81 | 19.14 | 3.13 | 3.12 |
| 07/28/14 | BCR | SQZ | Y | 148.95 | 153.13 | 149.48 | 0.36 | 2.81 |
| 08/01/14 | EXPE | CwH | N | 82.21 | 84.46 | 84.46 | 2.74 | 2.74 |
| 08/01/14 | CBM | CwH | N | 22.08 | 22.60 | 22.6 | 2.36 | 2.36 |
| 07/29/14 | CVC | CwH | N | 19.13 | 19.54 | 19.17 | 0.21 | 2.14 |
| 07/30/14 | FLT | SQZ | Y | 134.34 | 136.52 | 130.87 | -2.58 | 1.62 |
| 07/30/14 | FFIV | SQZ | Y | 114.39 | 115.67 | 112.2 | -1.91 | 1.12 |
| 07/30/14 | NMM | CwH | Y | 19.59 | 19.75 | 19.63 | 0.20 | 0.82 |
| 08/01/14 | MCK | SQZ | Y | 194.86 | 195.43 | 195.43 | 0.29 | 0.29 |
| 07/30/14 | VNTV | CwH | N | 34.55 | 34.60 | 32.96 | -4.60 | 0.14 |
| 07/29/14 | UIHC | SQZ | Y | 17.46 | 17.48 | 14.93 | -14.49 | 0.11 |
| Weekly Average (16 breakouts) | -1.51 | 2.61 | ||||||
No new features this week.
I damaged my right shoulder mountain biking and have limited movement in my right arm for typing so no top tip this week.
| Index | Value | Change Week | Change YTD | Trend | ||||||||||||||||||||||||||||||||||||
|---|---|---|---|---|---|---|---|---|---|---|---|---|---|---|---|---|---|---|---|---|---|---|---|---|---|---|---|---|---|---|---|---|---|---|---|---|---|---|---|---|
| Dow | 16493.4 | -2.75% | -0.5% | Down | ||||||||||||||||||||||||||||||||||||
| NASDAQ | 4352.64 | -2.18% | 4.22% | Up | ||||||||||||||||||||||||||||||||||||
| S&P 500 | 1925.15 | -2.69% | 4.15% | Down | ||||||||||||||||||||||||||||||||||||
1The Market Signal is derived
from our proprietary market model. The market model is
described on the site.
2The site also shows industry rankings based on fundamentals, combined technical and fundamentals, and on price alone. The site also shows daily industry movements. |
||||||||||||||||||||||||||||||||||||||||
|
Category
|
Symbol
|
Company Name
|
Expected Gain1
|
|---|---|---|---|
| Best Overall | PZE | Petrobras Argentina S.A. | 104 |
| Top Technical | PZE | Petrobras Argentina S.A. | 104 |
| Top Fundamental | FB | Facebook, Inc. | 38 |
| Top Tech. & Fund. | FB | Facebook, Inc. | 38 |
|
Category
|
Symbol
|
Company Name
|
Expected Gain1
|
|---|---|---|---|
| Best Overall | PEIX | Pacific Ethanol, Inc. | 65 |
| Top Technical | PEIX | Pacific Ethanol, Inc. | 65 |
| Top Fundamental | PEGA | Pegasystems Inc. | 48 |
| Top Tech. & Fund. | EXPE | Expedia, Inc. | 31 |
If you received this newsletter from a friend and you would like to receive it regularly please go to the BreakoutWatch.com site and enter as a Guest. You will then be able to register to receive the newsletter.
Copyright © 2014 NBIcharts, LLC dba BreakoutWatch.com. All rights
reserved.
" BreakoutWatch," the BreakoutWatch.com "eye" logo, and the slogan
"tomorrow's breakouts today" are service marks of NBIcharts LLC.
All other marks are the property of their respective owners, and
are used for descriptive purposes only.
BreakoutWatch is not affiliated with Investor's Business Daily or
with Mr. William O'Neil. Our site, research and analysis is
supported entirely by subscription and is free from advertising.