| Market Summary | Weekly Breakout Report | Top Breakout Choices | Top 2nd Chances | New Features | Tip of the Week |
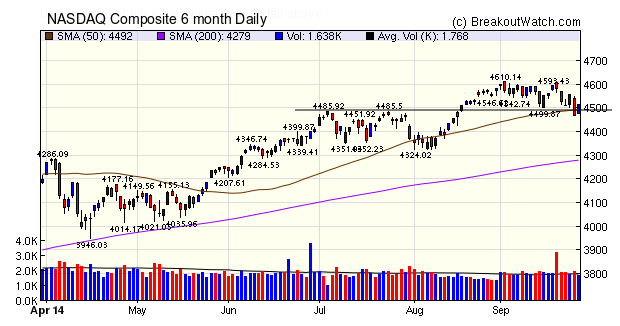
The NASDAQ Composite has formed a bearish double top (inverse of a double bottom) with the breakdown point at just below 4500. Although that level was breached on Thursday after AAPL brought down the whole NASDAQ index, the index recovered on Friday. The chart shows that the 4500 level is proving quite significant. It provided resistance in July and is now providing support. A sustained break below 4500 would be quite bearish.
As noted above, the NASDAQ is in a bearish pattern so unsurprisingly, the number of breakouts fell to 16 this week.
RDUS was the standout breakout with a gain of 39%. More about this below.
| Breakouts for Week Beginning 09/22/14 | ||||||||
| Brkout Date | Symbol | Base | Squeeze | BrkoutOut Price | Brkout Day Close | Last Close | Current % off BOP | Gain at Intraday High |
|---|---|---|---|---|---|---|---|---|
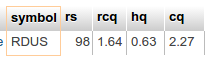
| 09/23/14 | RDUS | CwH | N | 15.98 | 17.95 | 22.24 | 39.17 | 39.17 |
| 09/24/14 | DOM | SQZ | Y | 7.25 | 7.49 | 7.98 | 10.07 | 10.07 |
| 09/26/14 | AGQ | HTF | N | 55.74 | 60.86 | 60.86 | 9.19 | 9.19 |
| 09/23/14 | TREE | CwH | N | 32.10 | 32.20 | 34.83 | 8.50 | 8.5 |
| 09/23/14 | CF | CwH | N | 260.25 | 269.37 | 277.86 | 6.77 | 6.77 |
| 09/25/14 | TWM | HSB | N | 55.84 | 57.00 | 58.93 | 5.53 | 5.53 |
| 09/26/14 | INSY | SQZ | Y | 36.30 | 38.16 | 38.16 | 5.12 | 5.12 |
| 09/23/14 | SPB | CwH | N | 87.91 | 88.56 | 90.22 | 2.63 | 2.63 |
| 09/24/14 | SPB | SQZ | Y | 88.96 | 89.42 | 90.22 | 1.42 | 1.42 |
| 09/25/14 | BRCD | CwH | Y | 10.65 | 10.72 | 10.8 | 1.41 | 1.41 |
| 09/26/14 | PII | SQZ | Y | 150.69 | 152.17 | 152.17 | 0.98 | 0.98 |
| 09/26/14 | TSRO | HSB | N | 26.87 | 27.09 | 27.09 | 0.82 | 0.82 |
| 09/26/14 | SHPG | CwH | N | 260.50 | 262.64 | 262.64 | 0.82 | 0.82 |
| 09/24/14 | HRG | CwH | Y | 13.16 | 13.24 | 13.19 | 0.23 | 0.61 |
| 09/26/14 | AOL | SQZ | Y | 44.47 | 44.55 | 44.55 | 0.18 | 0.18 |
| 09/24/14 | MLM | CwH | N | 132.19 | 132.25 | 130.73 | -1.10 | 0.05 |
| Weekly Average (16 breakouts) | 5.73 | 5.83 | ||||||
< New Features >
Chart Quality and Breakout Performance
In our "Chart Quality" page we describe the theoretically desirable features of a cup and handle chart pattern. We also attempt to quantify these features in three metrics: right cup quality (RCQ), handle quality (HQ) and overall chart quality (CQ).
RDUS, which broke out so strongly this week, was a classic CwH pattern which scored highly on these metrics.
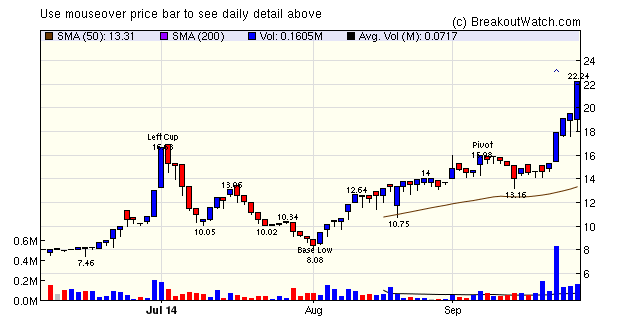
On this example, one would be tempted to think that these chart quality metrics are an important predictor of performance after breakout. Unfortunately, a statistical analysis of our breakout history, does not bear this out.
I looked at data for 2014 for all successful CwH breakouts (834) and compared the % gain 7 days after breakout to RCQ, HQ and CQ. The correlations I found were very low:
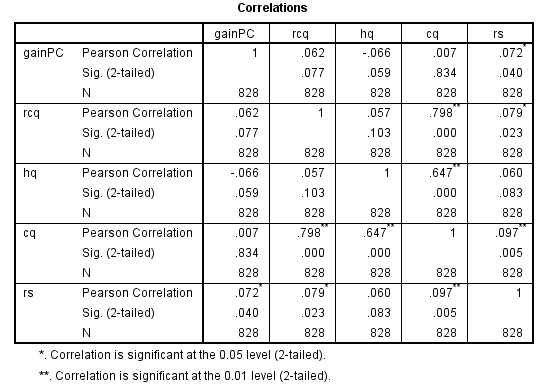
As you can see, neither RCQ, HQ or CQ of them were significantly correlated with the 7 day gain after breakout (gainPC). However, RS was significantly correlated, although still at a low level.
Conclusion
Theoretical chart quality is not a reliable predictor of performance after breakout. Statistically, higher RS rank values are correlated with breakout performance although the relationship s weak.
| Index | Value | Change Week | Change YTD | Trend | ||||||||||||||||||||||||||||||||||||
|---|---|---|---|---|---|---|---|---|---|---|---|---|---|---|---|---|---|---|---|---|---|---|---|---|---|---|---|---|---|---|---|---|---|---|---|---|---|---|---|---|
| Dow | 17113.2 | -0.96% | 3.24% | Up | ||||||||||||||||||||||||||||||||||||
| NASDAQ | 4512.19 | -1.48% | 8.04% | Up | ||||||||||||||||||||||||||||||||||||
| S&P 500 | 1982.85 | -1.37% | 7.28% | Up | ||||||||||||||||||||||||||||||||||||
1The Market Signal is derived
from our proprietary market model. The market model is
described on the site.
2The site also shows industry rankings based on fundamentals, combined technical and fundamentals, and on price alone. The site also shows daily industry movements. |
||||||||||||||||||||||||||||||||||||||||
|
Category
|
Symbol
|
Company Name
|
Expected Gain1
|
|---|---|---|---|
| Best Overall | RDNT | RadNet, Inc. | 97 |
| Top Technical | RDNT | RadNet, Inc. | 97 |
| Top Fundamental | MEOH | Methanex Corporation | 20 |
| Top Tech. & Fund. | MEOH | Methanex Corporation | 20 |
|
Category
|
Symbol
|
Company Name
|
Expected Gain1
|
|---|---|---|---|
| Best Overall | BRCD | Brocade Communications Systems, Inc. | 58 |
| Top Technical | BRCD | Brocade Communications Systems, Inc. | 58 |
| Top Fundamental | MLM | Martin Marietta Materials, Inc. | 19 |
| Top Tech. & Fund. | MLM | Martin Marietta Materials, Inc. | 19 |
If you received this newsletter from a friend and you would like to receive it regularly please go to the BreakoutWatch.com site and enter as a Guest. You will then be able to register to receive the newsletter.
Copyright © 2014 NBIcharts, LLC dba BreakoutWatch.com. All rights
reserved.
" BreakoutWatch," the BreakoutWatch.com "eye" logo, and the slogan
"tomorrow's breakouts today" are service marks of NBIcharts LLC.
All other marks are the property of their respective owners, and
are used for descriptive purposes only.
BreakoutWatch is not affiliated with Investor's Business Daily or
with Mr. William O'Neil. Our site, research and analysis is
supported entirely by subscription and is free from advertising.