| Market Summary | Weekly Breakout Report | Top Breakout Choices | Top 2nd Chances | New Features | Tip of the Week |
The NASDAQ Composite sold off on Monday and spent the rest of the week struggling to regain the lost ground. Positive job creation numbers on Friday allowed the index to close the week with an accumulation day, although volume was still below average. The index closed the week with a small loss while the larger cap indexes made modest gains and new highs. Lower fuel costs and rising employment, and for the first time, improving middle class wages should continue to lift the markets while inflation remains low and the Fed maintains effectively negative interest rates.
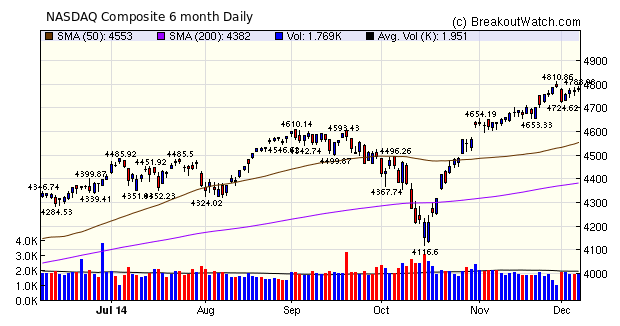
Low volumes continued to constrain the number of confirmed breakouts while the average gain for the week remained at a relatively high 4% and only one breakout closed under water.
| Breakouts for Week Beginning 12/01/14 | ||||||||
| Brkout Date | Symbol | Base | Squeeze | BrkoutOut Price | Brkout Day Close | Last Close | Current % off BOP | Gain at Intraday High |
|---|---|---|---|---|---|---|---|---|
| 12/04/14 | ESPR | HTF | N | 32.52 | 35.96 | 37.54 | 15.44 | 15.44 |
| 12/03/14 | GIII | CwH | N | 88.49 | 96.78 | 96.27 | 8.79 | 9.37 |
| 12/02/14 | ANIP | HTF | N | 55.74 | 58.51 | 53.29 | -4.40 | 8.02 |
| 12/02/14 | AERI | CwH | N | 27.24 | 28.51 | 29.31 | 7.60 | 7.6 |
| 12/04/14 | EEQ | CwH | N | 38.00 | 38.80 | 40.16 | 5.68 | 5.68 |
| 12/05/14 | BSFT | SQZ | Y | 28.02 | 29.56 | 29.56 | 5.50 | 5.5 |
| 12/04/14 | PFPT | SQZ | Y | 45.34 | 46.52 | 47.73 | 5.27 | 5.27 |
| 12/02/14 | KPTI | CwH | N | 43.30 | 43.85 | 44.84 | 3.56 | 5.27 |
| 12/05/14 | MANH | CwH | N | 40.56 | 42.38 | 42.38 | 4.49 | 4.49 |
| 12/03/14 | DTLK | CwH | N | 13.04 | 13.20 | 13.6 | 4.29 | 4.29 |
| 12/04/14 | SPNC | CwH | N | 33.47 | 33.49 | 34.82 | 4.03 | 4.03 |
| 12/02/14 | ABT | CwH | N | 44.59 | 45.22 | 45.3 | 1.59 | 2.44 |
| 12/04/14 | EEP | CwH | N | 39.86 | 40.77 | 40.74 | 2.21 | 2.28 |
| 12/02/14 | AHC | CwH | N | 12.13 | 12.21 | 12.38 | 2.06 | 2.06 |
| 12/05/14 | ULTA | CwH | N | 127.38 | 129.75 | 129.75 | 1.86 | 1.86 |
| 12/05/14 | ORAN | CwH | N | 17.60 | 17.89 | 17.89 | 1.65 | 1.65 |
| 12/05/14 | PNC | SQZ | Y | 88.77 | 90.18 | 90.18 | 1.59 | 1.59 |
| 12/02/14 | VVI | SQZ | Y | 25.28 | 25.33 | 25.48 | 0.79 | 0.79 |
| 12/04/14 | PGNX | CwH | N | 7.23 | 7.25 | 7.26 | 0.41 | 0.41 |
| 12/04/14 | FDO | SQZ | Y | 79.58 | 79.68 | 79.78 | 0.25 | 0.25 |
| 12/05/14 | MMSI | SQZ | Y | 15.56 | 15.57 | 15.57 | 0.06 | 0.06 |
| 12/05/14 | LFUS | SQZ | Y | 98.81 | 98.87 | 98.87 | 0.06 | 0.06 |
| Weekly Average (22 breakouts) | 3.31 | 4.02 | ||||||
No new features this week.
Risk Adjusted Return - Excellent Profits at Lower Risk
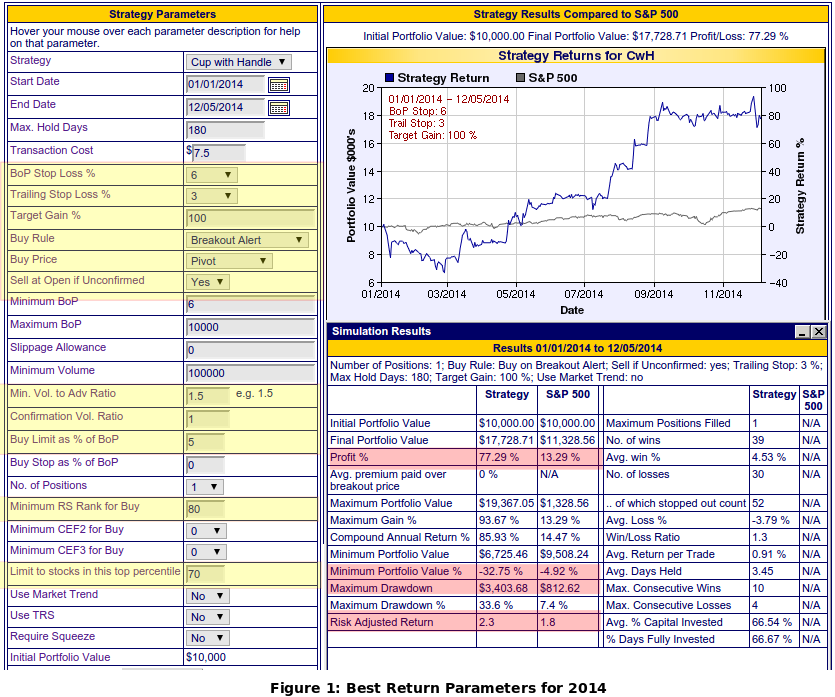
Our cup and handle backtest tool allows you to research the parameters for buying cup and handle stocks that give the best returns as market conditions change. I periodically run many simulations of the tool testing many different scenarios and the last time I did that was in May, 2014 (see Important Strategy Revisions).
I did so again this week and found the maximum return since the start of the year would have been obtained with the settings shown in figure 1 below (click image to expand). The important parameters are highlighted in yellow. The key results are highlighted in red. Note that the overall return was 77.3% but that the drawdown was $3,403.7 (32.8%). (Drawdown is the maximum loss sustained in the portfolio). It would be the bold investor indeed that would tolerate a 33% loss before abandoning the strategy.
In the same figure, look at the "Risk Adjusted Return" which rates as 2.3. This is the total profit divided by the maximum drawdown. It is how much capital was put at risk to obtain the overall profit.
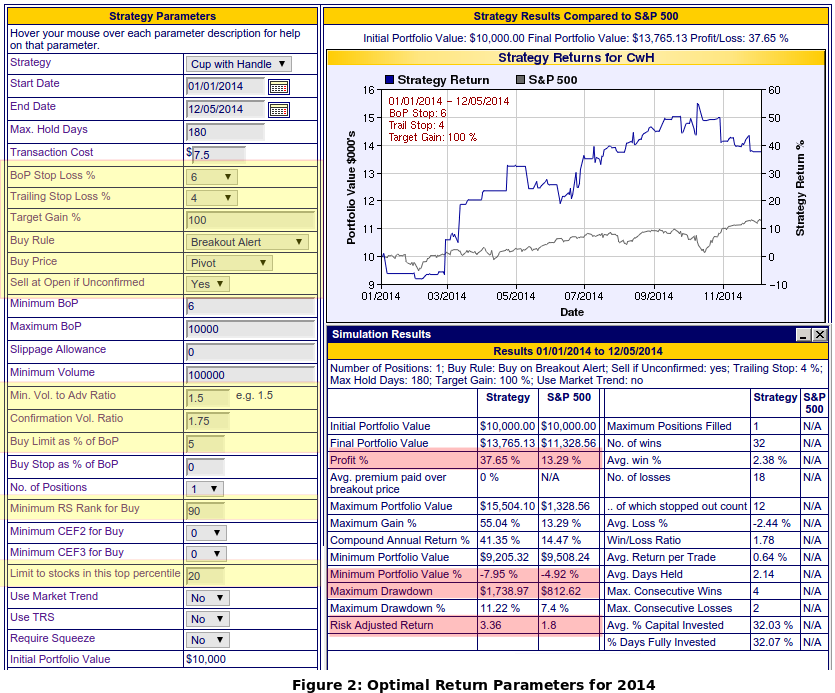
Suppose that instead of looking for maximum possible profit we looked for maximum risk adjusted return. This would give us Figure 2. Our drawdown has been reduced to 11.2% of our initial capital and our profit is 37.7%. This is still an excellent return when a passive investment in the S&P 500 returned only 13.3%.
Conclusion
For the optimal return (best profit at least risk) I now recommend the following trading strategy for cup with handle stocks:
- Each day, create a personal watchlist of stocks that satisfy
- RS Rank must be at least 90
- Industry Rank must be in the top 20 percentile (i.e. have a rank less than 43 in our industry ranking scheme
- Average daily volume >= 100,000.
- Buy on alert
- Sell at next open if volume at end of breakout day is less than 1.75 times average 50 day volume
- Sell if stock drops 6% or more from the breakout price.
- After purchase set a 4% trailing stop by monitoring daily high's and setting a stop loss at 4% of the maximum high after breakout. Adjust daily if necessary.
- Sell if trailing stop met intraday.
| Index | Value | Change Week | Change YTD | Trend | ||||||||||||||||||||||||||||||||||||
|---|---|---|---|---|---|---|---|---|---|---|---|---|---|---|---|---|---|---|---|---|---|---|---|---|---|---|---|---|---|---|---|---|---|---|---|---|---|---|---|---|
| Dow | 17958.8 | 0.73% | 8.34% | Up | ||||||||||||||||||||||||||||||||||||
| NASDAQ | 4780.75 | -0.23% | 14.47% | Up | ||||||||||||||||||||||||||||||||||||
| S&P 500 | 2075.37 | 0.38% | 12.28% | Up | ||||||||||||||||||||||||||||||||||||
1The Market Signal is derived
from our proprietary market model. The market model is
described on the site.
2The site also shows industry rankings based on fundamentals, combined technical and fundamentals, and on price alone. The site also shows daily industry movements. |
||||||||||||||||||||||||||||||||||||||||
|
Category
|
Symbol
|
Company Name
|
Expected Gain1
|
|---|---|---|---|
| Best Overall | FTR | Frontier Communications Corporation | 101 |
| Top Technical | FTR | Frontier Communications Corporation | 101 |
| Top Fundamental | BITA | Bitauto Holdings Limited | 58 |
| Top Tech. & Fund. | BITA | Bitauto Holdings Limited | 58 |
|
Category
|
Symbol
|
Company Name
|
Expected Gain1
|
|---|---|---|---|
| Best Overall | PGNX | Progenics Pharmaceuticals Inc. | 100 |
| Top Technical | PGNX | Progenics Pharmaceuticals Inc. | 100 |
| Top Fundamental | ULTA | Ulta Salon, Cosmetics & Fragrance, Inc. | 34 |
| Top Tech. & Fund. | ULTA | Ulta Salon, Cosmetics & Fragrance, Inc. | 34 |
If you received this newsletter from a friend and you would like to receive it regularly please go to the BreakoutWatch.com site and enter as a Guest. You will then be able to register to receive the newsletter.
Copyright © 2014 NBIcharts, LLC dba BreakoutWatch.com. All rights
reserved.
" BreakoutWatch," the BreakoutWatch.com "eye" logo, and the slogan
"tomorrow's breakouts today" are service marks of NBIcharts LLC.
All other marks are the property of their respective owners, and
are used for descriptive purposes only.
BreakoutWatch is not affiliated with Investor's Business Daily or
with Mr. William O'Neil. Our site, research and analysis is
supported entirely by subscription and is free from advertising.