| Market Summary | Weekly Breakout Report | Top Breakout Choices | Top 2nd Chances | New Features | Tip of the Week |
The NASDAQ broke above the neckline of the bearish head and shoulders top (HST) pattern last Friday which set up another V-bottom recovery when the markets opened on Tuesday. I wrote about the V-bottom and why it occurs here and this was another situation where an intraday reversal caught the shorts unawares and prompted a short covering rally. The HST pattern is normally reliably bearish, as I explained last week, but this time the bears were caught literally with their shorts down.
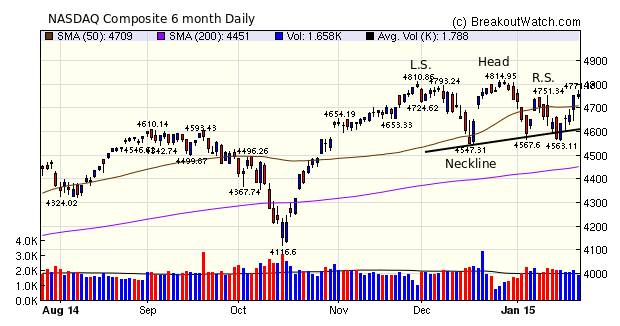
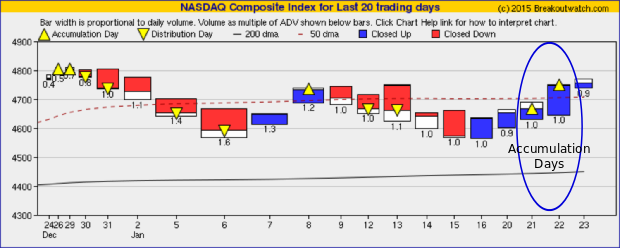
The week also brought two accumulation days but our trend indicator has not yet turned bullish The trend indicator is unfortunately a lagging indicator but I would expect that to change in a day or two if the recovery continues.
The number of breakouts jumped up to 30 this week. Although SqueezePlay breakouts were common (11) with an average gain of 2.5%, they were outnumbered by cup and handle breakouts (16) with an average gain of 2.1%.
| Breakouts for Week Beginning 01/19/15 | ||||||||
| Brkout Date | Symbol | Base | Squeeze | BrkoutOut Price | Brkout Day Close | Last Close | Current % off BOP | Gain at Intraday High |
|---|---|---|---|---|---|---|---|---|
| 01/20/15 | OWW | CwH | N | 9.34 | 9.95 | 9.97 | 6.75 | 6.85 |
| 01/22/15 | QSII | SQZ | Y | 16.30 | 17.14 | 17.24 | 5.77 | 5.77 |
| 01/23/15 | PCRX | CwH | N | 101.92 | 106.54 | 106.54 | 4.53 | 4.53 |
| 01/22/15 | MDCA | SQZ | Y | 23.65 | 24.12 | 24.68 | 4.36 | 4.36 |
| 01/22/15 | SBAC | DB | N | 113.64 | 116.47 | 118.38 | 4.17 | 4.17 |
| 01/22/15 | AAN | CwH | N | 31.10 | 32.17 | 32.38 | 4.12 | 4.12 |
| 01/20/15 | PAM | SQZ | Y | 10.20 | 10.28 | 10.48 | 2.75 | 3.92 |
| 01/23/15 | HOFT | CwH | N | 17.71 | 18.33 | 18.33 | 3.50 | 3.5 |
| 01/21/15 | JAZZ | SQZ | Y | 170.30 | 174.98 | 175.56 | 3.09 | 3.46 |
| 01/21/15 | APTS | CwH | N | 9.57 | 9.66 | 9.86 | 3.03 | 3.03 |
| 01/20/15 | TEVA | DB | N | 58.26 | 58.44 | 59.88 | 2.78 | 2.78 |
| 01/22/15 | CRTO | SQZ | Y | 42.07 | 43 | 41.57 | -1.19 | 2.21 |
| 01/23/15 | ULTA | CwH | Y | 132.43 | 135.34 | 135.34 | 2.20 | 2.2 |
| 01/22/15 | BX | SQZ | Y | 35.30 | 35.71 | 36.06 | 2.15 | 2.15 |
| 01/22/15 | BV | SQZ | Y | 8.49 | 8.52 | 8.67 | 2.12 | 2.12 |
| 01/22/15 | EXL | CwH | N | 14.00 | 14.27 | 14.14 | 1.00 | 1.93 |
| 01/20/15 | CACC | SQZ | Y | 139.94 | 142.26 | 137.88 | -1.47 | 1.66 |
| 01/22/15 | MKTX | CwH | N | 73.25 | 74.44 | 74.02 | 1.05 | 1.62 |
| 01/22/15 | EBS | CwH | N | 28.48 | 28.91 | 28.39 | -0.32 | 1.51 |
| 01/21/15 | CRUS | SQZ | Y | 24.75 | 24.85 | 25.08 | 1.33 | 1.45 |
| 01/20/15 | ATRC | CwH | N | 20.37 | 20.66 | 20.22 | -0.74 | 1.42 |
| 01/22/15 | CSV | CwH | N | 21.53 | 21.68 | 21.81 | 1.30 | 1.3 |
| 01/21/15 | PENN | CwH | N | 15.42 | 15.59 | 15.32 | -0.65 | 1.1 |
| 01/23/15 | SCO | HTF | N | 102.03 | 102.80 | 102.8 | 0.75 | 0.75 |
| 01/20/15 | PRFT | SQZ | Y | 19.70 | 19.82 | 19.2 | -2.54 | 0.61 |
| 01/22/15 | GFF | CwH | N | 13.71 | 13.73 | 13.67 | -0.29 | 0.15 |
| 01/22/15 | OMAB | SQZ | Y | 37.49 | 37.53 | 37.25 | -0.64 | 0.11 |
| 01/23/15 | SIMO | CwH | N | 26.44 | 26.46 | 26.46 | 0.08 | 0.08 |
| 01/20/15 | VOLC | CwH | N | 17.95 | 17.95 | 17.96 | 0.06 | 0.06 |
| 01/22/15 | BRP | CwH | N | 24.15 | 24.16 | 24.09 | -0.25 | 0.04 |
| Weekly Average (30 breakouts) | 1.63 | 2.3 | ||||||
ETF Filter on Watchlists
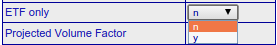
There is now a filter on each watchlist that allows the display of ETFs only. You will see it at the bottom of the filter drop down. The default is 'n' or no. Select 'y' to see ETF's on the list only.
This filter was added following a request from a subscriber. If you would like some feature that is not yet available, please let me know.
How Often are ETF's Breakout Candidates?
Now that we have an ETF filter, the question arises as to how often do ETF's breakouts? There were none this week so I investigated further.
On the current set of watchlists there no ETF's listed.
This table show the number of ETF's on the watchlists since January 1, 2014 and the number that broke out:
| List | Count | Breakouts |
|---|---|---|
| CWH | 461 | 5 |
| DB | 76 | |
| HSB | 59 | |
| HST | 13 | |
| HTF | 3 | |
| SQZ | 198 | 3 |
| SQZX | 71 | |
| SS | 31 | |
| Total |
912 |
8 |
The statistics show that successful ETF breakouts are extremely rare.
| Index | Value | Change Week | Change YTD | Trend | ||||||||||||||||||||||||||||||||||||
|---|---|---|---|---|---|---|---|---|---|---|---|---|---|---|---|---|---|---|---|---|---|---|---|---|---|---|---|---|---|---|---|---|---|---|---|---|---|---|---|---|
| Dow | 17672.6 | 0.92% | -0.84% | Down | ||||||||||||||||||||||||||||||||||||
| NASDAQ | 4757.88 | 2.66% | 0.46% | Down | ||||||||||||||||||||||||||||||||||||
| S&P 500 | 2051.82 | 1.6% | -0.34% | Down | ||||||||||||||||||||||||||||||||||||
1The Market Signal is derived
from our proprietary market model. The market model is
described on the site.
2The site also shows industry rankings based on fundamentals, combined technical and fundamentals, and on price alone. The site also shows daily industry movements. |
||||||||||||||||||||||||||||||||||||||||
|
Category
|
Symbol
|
Company Name
|
Expected Gain1
|
|---|---|---|---|
| Best Overall | PGNX | Progenics Pharmaceuticals Inc. | 102 |
| Top Technical | PGNX | Progenics Pharmaceuticals Inc. | 102 |
| Top Fundamental | MWIV | MWI Veterinary Supply, Inc. | 29 |
| Top Tech. & Fund. | NOAH | Noah Holdings Ltd. | 53 |
|
Category
|
Symbol
|
Company Name
|
Expected Gain1
|
|---|---|---|---|
| Best Overall | APTS | Preferred Apartment Communities, Inc. | 66 |
| Top Technical | CSV | Carriage Services, Inc. | 0 |
| Top Fundamental | ULTA | Ulta Salon, Cosmetics & Fragrance, Inc. | 26 |
| Top Tech. & Fund. | ULTA | Ulta Salon, Cosmetics & Fragrance, Inc. | 26 |
If you received this newsletter from a friend and you would like to receive it regularly please go to the BreakoutWatch.com site and enter as a Guest. You will then be able to register to receive the newsletter.
Copyright © 2015 NBIcharts, LLC dba BreakoutWatch.com. All rights
reserved.
" BreakoutWatch," the BreakoutWatch.com "eye" logo, and the slogan
"tomorrow's breakouts today" are service marks of NBIcharts LLC.
All other marks are the property of their respective owners, and
are used for descriptive purposes only.
BreakoutWatch is not affiliated with Investor's Business Daily or
with Mr. William O'Neil. Our site, research and analysis is
supported entirely by subscription and is free from advertising.