| Market Summary | Weekly Breakout Report | Top Breakout Choices | Top 2nd Chances | New Features | Tip of the Week |
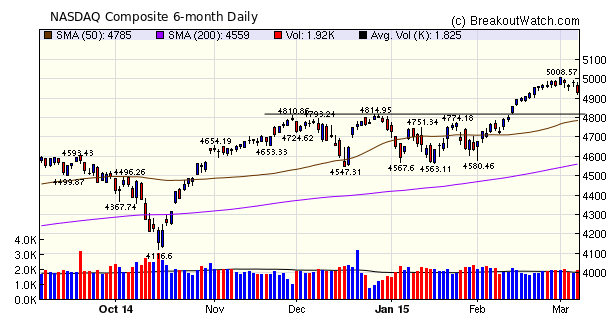
The major indexes lost ground this week mainly due to Friday's distribution day as investors feared a sooner than expected interest rate hike. This seems like an overreaction as the expected interest rate increase is several months away and will inevitably be incremental. Market always over-react to seemingly apparent bad news so let's not behave as though the sky is falling. The NASDAQ chart shows where support lies, which is still historically a pretty good level.
The number of breakouts rose from 22 to 25 this week. Interestingly, the two top performers on breakout were head and shoulders bottom stocks with wildly divergent RS Rank values. PBYI had an RS Rank of 98 while STAA had a lowly RS Rank of just 4. We have consistently recommended choosing stocks with an RS Rank above 92 so what explains this dichotomy? We'll examine this in our Top Tip below.
| Breakouts for Week Beginning 03/02/15 | |||||||||
| Brkout Date | Symbol | Base | Squeeze | BrkoutOut Price | Brkout Day Close | RS Rank* | Last Close | Current % off BOP | Gain at Intraday High |
|---|---|---|---|---|---|---|---|---|---|
| 03/05/15 | PBYI | HSB | N | 209.91 | 243.17 | 98.00 | 232.83 | 10.92 | 15.84 |
| 03/03/15 | STAA | HSB | N | 6.94 | 7.76 | 4.00 | 7.28 | 4.90 | 11.82 |
| 03/05/15 | RGLS | CwH | N | 19.30 | 21.13 | 98.00 | 20.7 | 7.25 | 9.48 |
| 03/04/15 | PTX | CwH | N | 10.90 | 11.54 | 97.00 | 11.78 | 8.07 | 8.07 |
| 03/05/15 | NVEE | CwH | N | 13.47 | 14.19 | 92.00 | 14.24 | 5.72 | 5.72 |
| 03/06/15 | HTBX | CwH | N | 6.99 | 7.35 | 95.00 | 7.35 | 5.15 | 5.15 |
| 03/04/15 | SWHC | CwH | N | 13.70 | 14.34 | 82.00 | 14.23 | 3.87 | 5.11 |
| 03/05/15 | OLED | CwH | N | 37.20 | 38.87 | 90.00 | 38.58 | 3.71 | 4.49 |
| 03/02/15 | IDCC | CwH | N | 53.71 | 54.06 | 92.00 | 52.07 | -3.05 | 3.43 |
| 03/06/15 | RTRX | CwH | N | 14.90 | 15.37 | 88.00 | 15.37 | 3.15 | 3.15 |
| 03/02/15 | ACHC | CwH | N | 64.78 | 66.29 | 87.00 | 66.72 | 2.99 | 3.13 |
| 03/02/15 | ST | CwH | N | 55.30 | 56.22 | 84.00 | 55.99 | 1.25 | 3.04 |
| 03/03/15 | DXPE | HSB | N | 46.47 | 47.30 | 6.00 | 47.84 | 2.95 | 2.95 |
| 03/02/15 | LMNS | CwH | N | 11.65 | 11.79 | 84.00 | 11.71 | 0.52 | 2.75 |
| 03/02/15 | CISG | CwH | N | 8.48 | 8.68 | 88.00 | 7.83 | -7.67 | 2.36 |
| 03/04/15 | CHGG | CwH | N | 8.60 | 8.75 | 93.00 | 8.3 | -3.49 | 1.74 |
| 03/05/15 | FLTX | CwH | N | 43.00 | 43.08 | 92.00 | 43.52 | 1.21 | 1.21 |
| 03/05/15 | KONA | CwH | N | 26.54 | 26.79 | 91.00 | 26.11 | -1.62 | 0.94 |
| 03/02/15 | TW | CwH | N | 133.45 | 134.62 | 87.00 | 129.11 | -3.25 | 0.88 |
| 03/02/15 | KAR | CwH | N | 37.02 | 37.32 | 82.00 | 37.03 | 0.03 | 0.81 |
| 03/02/15 | BIG | CwH | N | 48.58 | 48.88 | 84.00 | 48.52 | -0.12 | 0.62 |
| 03/05/15 | ROIC | DB | N | 17.40 | 17.47 | 74.00 | 16.86 | -3.10 | 0.4 |
| 03/02/15 | JBT | CwH | N | 35.39 | 35.52 | 83.00 | 33.54 | -5.23 | 0.37 |
| 03/05/15 | IRS | CwH | N | 17.23 | 17.29 | 82.00 | 17.27 | 0.23 | 0.35 |
| 03/02/15 | MCS | CwH | N | 19.91 | 19.97 | 87.00 | 19.12 | -3.97 | 0.3 |
| Weekly Average (25 breakouts) | 1.22 | 3.76 | |||||||
| *RS Rank on day before breakout. | |||||||||
Indicator Added to Alert Monitor
Last week's newsletter showing that cup and handle pattern stocks (CWH) within 95% of the breakout price have a 90% chance of successful breakout was met with interest and a request that I add an indicator to the Alert Monitor to designate such stocks. This has been done. These stocks are flagged with an asterisk (*) next to their RS Rank.
Not surprisingly though, you will find that 90% of the stocks on the alert monitor that come from a CWH pattern are flagged.
An In-Depth Look at the Calculation of RS Rank
Our two top performing stocks this week had RS Rank values of 4 and 98. Both stocks broke out from a head and shoulders bottom pattern (HSB). Since this pattern applies to stocks that are just recovering from a deep decline, how could one of them have an RS Rank of 98? A quick look at the chart for PBYI gave me the answer so I thought I would use it as a way to illustrate how RS Rank is calculated
Firstly, consider how the RS Rank value is calculated:
Raw RS Rank = 12 month
Weighted Price Change
= (Price change this quarter *
40%)
+ (Price change 1 qtr ago * 20%)
+ (Price change 2 qtrs ago * 20%)
+ (Price change 3 qtrs ago * 20%)
+ (Price change 1 qtr ago * 20%)
+ (Price change 2 qtrs ago * 20%)
+ (Price change 3 qtrs ago * 20%)
(Note that the price
change three quarters ago counts for 1/5 (20%) of the
weighting.)
The raw score is then ranked against the raw score for all other stocks and a final RS Rank in the range 1-99 is calculated
Now look at the 12 month chart for PBYI
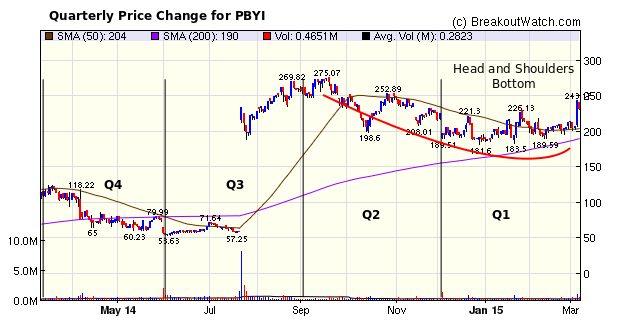
We can see that although the the price was dropping over the last two quarters, ending in a HSB pattern, the price was almost 4 times higher than 3 quarters ago and double compared to 4 quarters ago.
The Raw RS calculation for PBYI is then
Let's compare that to the Raw RS for NASDAQ Composite as we don't have an index for all stocks
So the Raw RS Rank for PBYI is substantially higher than for the NASDAQ as a whole. You can therefore see why PBYI would rank at 98 when ranked against all other stocks. However, note that before the turn up, PBYI would still have had a very high RS Rank, so RS Rank does not always indicate a stock is moving higher. At its lowest close on January 6, the RS Rank was still a very high 97.
The Interpretation of RS Rank
Our RS Rank compares a stock's performance over 12 months to all other stocks in our database (approx. 6,000). In general a high RS Rank denotes a stock is performing well, but as we have seen, a falling stock may still have a high RS Rank. What is important is that RS Rank be improving. This will usually be the case for our 'long' patterns.
So, don't rely solely on RS Rank as an indicator of possible future performance, always look at the chart as well.
The raw score is then ranked against the raw score for all other stocks and a final RS Rank in the range 1-99 is calculated
Now look at the 12 month chart for PBYI
We can see that although the the price was dropping over the last two quarters, ending in a HSB pattern, the price was almost 4 times higher than 3 quarters ago and double compared to 4 quarters ago.
The Raw RS calculation for PBYI is then
| Change from | ||||||
| Date | Close | Q1 | Q2 | Q3 | Q4 | |
| 2014-Apr-04 | 106.41 | |||||
| 2014-Jul-03 | 70 | |||||
| 2014-Oct-03 | 250 | |||||
| 2015-Jan-02 | 189.86 | |||||
| 42067.00 | 206.96 | 1.09 | 0.83 | 2.96 | 1.94 | |
| Weight | 0.4 | 0.2 | 0.2 | 0.2 | ||
| Raw Score | 0.43603 | 0.16557 | 0.59131 | 0.38899 | ||
| Raw RS | 1.58189 | |||||
Let's compare that to the Raw RS for NASDAQ Composite as we don't have an index for all stocks
| Change from | ||||||
| Date | Close | Q1 | Q2 | Q3 | Q4 | |
| 2014-Apr-04 | 4127.73 | |||||
| 2014-Jul-03 | 4485.92 | |||||
| 2014-Oct-03 | 4475.62 | |||||
| 2015-Jan-02 | 4726.81 | |||||
| 2015-Mar-04 | 4967.14 | 1.05 | 1.11 | 1.11 | 1.20 | |
| Weight | 0.4 | 0.2 | 0.2 | 0.2 | ||
| Raw Score | 0.42034 | 0.22196 | 0.22145 | 0.24067 | ||
| Raw RS | 1.10443 | |||||
So the Raw RS Rank for PBYI is substantially higher than for the NASDAQ as a whole. You can therefore see why PBYI would rank at 98 when ranked against all other stocks. However, note that before the turn up, PBYI would still have had a very high RS Rank, so RS Rank does not always indicate a stock is moving higher. At its lowest close on January 6, the RS Rank was still a very high 97.
The Interpretation of RS Rank
Our RS Rank compares a stock's performance over 12 months to all other stocks in our database (approx. 6,000). In general a high RS Rank denotes a stock is performing well, but as we have seen, a falling stock may still have a high RS Rank. What is important is that RS Rank be improving. This will usually be the case for our 'long' patterns.
So, don't rely solely on RS Rank as an indicator of possible future performance, always look at the chart as well.
| Index | Value | Change Week | Change YTD | Trend | ||||||||||||||||||||||||||||||||||||
|---|---|---|---|---|---|---|---|---|---|---|---|---|---|---|---|---|---|---|---|---|---|---|---|---|---|---|---|---|---|---|---|---|---|---|---|---|---|---|---|---|
| Dow | 17856.8 | -1.52% | 0.19% | Up | ||||||||||||||||||||||||||||||||||||
| NASDAQ | 4927.37 | -0.73% | 4.04% | Up | ||||||||||||||||||||||||||||||||||||
| S&P 500 | 2071.26 | -1.58% | 0.6% | Up | ||||||||||||||||||||||||||||||||||||
1The Market Signal is derived
from our proprietary market model. The market model is
described on the site.
2The site also shows industry rankings based on fundamentals, combined technical and fundamentals, and on price alone. The site also shows daily industry movements. |
||||||||||||||||||||||||||||||||||||||||
|
Category
|
Symbol
|
Company Name
|
Expected Gain1
|
|---|---|---|---|
| Best Overall | RAD | Rite Aid Corporation | 101 |
| Top Technical | RAD | Rite Aid Corporation | 101 |
| Top Fundamental | MDXG | MiMedx Group, Inc | 89 |
| Top Tech. & Fund. | MDXG | MiMedx Group, Inc | 89 |
|
Category
|
Symbol
|
Company Name
|
Expected Gain1
|
|---|---|---|---|
| Best Overall | RTRX | Retrophin, Inc. | 71 |
| Top Technical | OLED | Universal Display Corporation | 46 |
| Top Fundamental | ACHC | Acadia Healthcare Company, Inc. | 47 |
| Top Tech. & Fund. | FLTX | Fleetmatics Group PLC | 43 |
If you received this newsletter from a friend and you would like to receive it regularly please go to the BreakoutWatch.com site and enter as a Guest. You will then be able to register to receive the newsletter.
Copyright © 2015 NBIcharts, LLC dba BreakoutWatch.com. All rights
reserved.
" BreakoutWatch," the BreakoutWatch.com "eye" logo, and the slogan
"tomorrow's breakouts today" are service marks of NBIcharts LLC.
All other marks are the property of their respective owners, and
are used for descriptive purposes only.
BreakoutWatch is not affiliated with Investor's Business Daily or
with Mr. William O'Neil. Our site, research and analysis is
supported entirely by subscription and is free from advertising.