| Market Summary | Weekly Breakout Report | Top Breakout Choices | Top 2nd Chances | New Features | Tip of the Week |
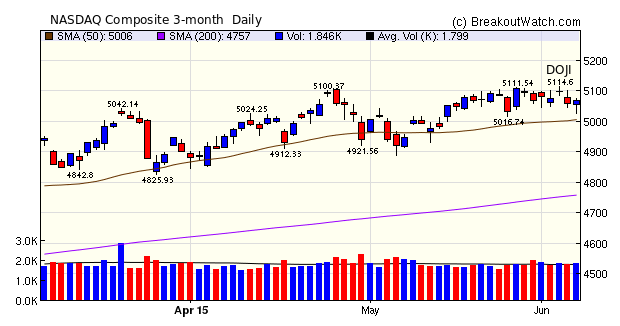
The NASDAQ Composite set a new high on Wednesday but traders were uncertain that the high would hold resulting in a "Doji" candlestick pattern(see chart below). The "Doji" pattern indicates uncertainty about the future direction as the pattern shows an almost equal open and close but with trading above and below during the session. Thursday resolved the uncertainty to the downside as Greece postponed a debt payment to the IMF but a strong jobs report on Friday allowed the index to close for a small 0.2% gain. Overall, the index closed the week for a very small 0.03% loss. While our trend indicators for the NASDAQ and S&P 500 remain positive, the signs of an improving economy are sure to rekindle worries that the Fed will soon begin to raise interest rates with a negative effect on market sentiment.
Volatility Squeeze breakouts continued to dominate the week's breakouts with 38 out of 68 breakouts and an average gain of 3.8%. AXDX provides an interesting case study and we look at in detail in our Top Tip below.
| Breakouts for Week Beginning 06/01/15 | |||||||||
| Brkout Date | Symbol | Base | Squeeze | BrkoutOut Price | Brkout Day Close | RS Rank* | Last Close | Current % off BOP | Gain at Intraday High |
|---|---|---|---|---|---|---|---|---|---|
| 06/04/15 | WBAI* | HTF | N | 22.62 | 23.00 | 89 | 26.06 | 15.21 | 15.21 |
| 06/04/15 | VISN* | SQZ | Y | 15.65 | 17.75 | 84 | 17.38 | 11.05 | 13.42 |
| 06/04/15 | AXDX* | SQZ | Y | 24.37 | 25.91 | 87 | 27.29 | 11.98 | 11.98 |
| 06/01/15 | NWBO* | SQZ | Y | 8.43 | 8.56 | 92 | 9.43 | 11.86 | 11.86 |
| 06/01/15 | UEPS* | CwH | N | 14.84 | 15.91 | 82 | 16.07 | 8.29 | 10.51 |
| 06/02/15 | NDRM | CwH | N | 14.40 | 15.08 | 90 | 15.74 | 9.31 | 9.31 |
| 06/02/15 | IBP | SQZ | Y | 21.32 | 22.57 | 92 | 23.23 | 8.96 | 8.96 |
| 06/02/15 | GWPH | SQZ | Y | 115.76 | 120.3 | 96 | 125.98 | 8.83 | 8.83 |
| 06/03/15 | PGTI | CwH | N | 12.48 | 13.07 | 85 | 13.53 | 8.41 | 8.41 |
| 06/01/15 | TNK | CwH | N | 7.28 | 7.63 | 95 | 7.52 | 3.30 | 7.42 |
| 06/03/15 | GLOB | CwH | N | 26.66 | 27.82 | 97 | 28.31 | 6.19 | 6.19 |
| 06/01/15 | IPXL | SQZ | Y | 47.06 | 48.9 | 95 | 48.59 | 3.25 | 6.06 |
| 06/03/15 | AMWD | SQZ | Y | 53.86 | 56.07 | 91 | 57.11 | 6.03 | 6.03 |
| 06/02/15 | LXFT | SQZ | Y | 53.99 | 54.47 | 91 | 57.06 | 5.69 | 5.69 |
| 06/03/15 | LXFT | SQZ | Y | 54.48 | 55 | 93 | 57.06 | 4.74 | 4.74 |
| 06/03/15 | AAC | CwH | N | 39.98 | 41.48 | 91 | 41.87 | 4.73 | 4.73 |
| 06/03/15 | LAD | SQZ | Y | 108.26 | 110.27 | 90 | 113.17 | 4.54 | 4.54 |
| 06/02/15 | SHOO | SQZ | Y | 38.59 | 38.6 | 80 | 40.29 | 4.41 | 4.41 |
| 06/03/15 | MXL | CwH | N | 10.32 | 10.76 | 86 | 10.7 | 3.68 | 4.26 |
| 06/01/15 | MYRG | SQZ | Y | 29.65 | 29.65 | 81 | 30.48 | 2.80 | 4.22 |
| 06/05/15 | SPCB | CwH | N | 13.28 | 13.84 | 92 | 13.84 | 4.22 | 4.22 |
| 06/03/15 | AFOP | CwH | N | 19.76 | 20.58 | 84 | 20.19 | 2.18 | 4.15 |
| 06/02/15 | WIBC | CwH | N | 11.20 | 11.25 | 81 | 11.66 | 4.11 | 4.11 |
| 06/01/15 | TWOU | SQZ | Y | 27.83 | 28.23 | 96 | 28.97 | 4.10 | 4.1 |
| 06/04/15 | INSY | SQZ | Y | 61.80 | 63.56 | 96 | 64.29 | 4.03 | 4.03 |
| 06/05/15 | REGN | CwH | N | 519.46 | 539.40 | 93 | 539.4 | 3.84 | 3.84 |
| 06/04/15 | LXFT | SQZ | Y | 55.01 | 55.36 | 93 | 57.06 | 3.73 | 3.73 |
| 06/03/15 | XNCR | CwH | N | 18.34 | 18.96 | 95 | 19.01 | 3.65 | 3.65 |
| 06/03/15 | CVGW | CwH | Y | 54.69 | 56.54 | 92 | 55.92 | 2.25 | 3.62 |
| 06/04/15 | LAKE | CwH | N | 11.00 | 11.37 | 83 | 11 | 0.00 | 3.36 |
| 06/03/15 | CALD | SQZ | Y | 14.52 | 15 | 82 | 14.86 | 2.34 | 3.31 |
| 06/01/15 | MIK | SQZ | Y | 27.36 | 27.52 | 84 | 26.98 | -1.39 | 3.25 |
| 06/03/15 | IBP | SQZ | Y | 22.54 | 22.74 | 94 | 23.23 | 3.06 | 3.06 |
| 06/04/15 | EXPR | CwH | N | 18.10 | 18.49 | 89 | 18.65 | 3.04 | 3.04 |
| 06/01/15 | NSTG | CwH | N | 14.38 | 14.62 | 82 | 14.8 | 2.92 | 2.92 |
| 06/03/15 | SPWH | CwH | N | 10.11 | 10.15 | 92 | 10.4 | 2.87 | 2.87 |
| 06/05/15 | INSM | SQZ | Y | 23.42 | 24.08 | 95 | 24.08 | 2.82 | 2.82 |
| 06/04/15 | AEO | SQZ | Y | 16.48 | 16.91 | 86 | 16.57 | 0.55 | 2.61 |
| 06/04/15 | TXRH | SQZ | Y | 35.67 | 35.72 | 81 | 36.57 | 2.52 | 2.52 |
| 06/02/15 | MMSI | SQZ | Y | 20.77 | 21 | 88 | 20.9 | 0.63 | 2.36 |
| 06/03/15 | VDSI | CwH | N | 27.85 | 28.46 | 95 | 28.5 | 2.33 | 2.33 |
| 06/01/15 | GSIG | CwH | N | 14.96 | 15.12 | 83 | 15.1 | 0.94 | 2.27 |
| 06/02/15 | ANW | SQZ | Y | 14.77 | 15 | 88 | 15.06 | 1.96 | 2.1 |
| 06/02/15 | CORT | SQZ | Y | 6.19 | 6.28 | 98 | 6.32 | 2.10 | 2.1 |
| 06/03/15 | HVB | SQZ | Y | 26.02 | 26.36 | 83 | 26.56 | 2.08 | 2.08 |
| 06/02/15 | OPY | CwH | N | 26.24 | 26.50 | 85 | 26.76 | 1.98 | 1.98 |
| 06/04/15 | CIEN | CwH | N | 24.55 | 24.64 | 89 | 25 | 1.83 | 1.83 |
| 06/03/15 | CUDA | SQZ | Y | 40.11 | 40.77 | 88 | 40.82 | 1.77 | 1.77 |
| 06/01/15 | DOOR | SQZ | Y | 68.10 | 69.3 | 84 | 68.8 | 1.03 | 1.76 |
| 06/03/15 | DLTR | SQZ | Y | 77.72 | 79.08 | 83 | 77.64 | -0.10 | 1.75 |
| 06/01/15 | COO | SQZ | Y | 181.72 | 182.97 | 83 | 175.37 | -3.49 | 1.72 |
| 06/04/15 | CAVM | CwH | N | 72.65 | 73.42 | 85 | 73.88 | 1.69 | 1.69 |
| 06/01/15 | PFSI | CwH | Y | 18.99 | 19.00 | 80 | 19.3 | 1.63 | 1.63 |
| 06/02/15 | ULTA | SQZ | Y | 153.83 | 154.35 | 91 | 156.28 | 1.59 | 1.59 |
| 06/02/15 | PFSI | SQZ | Y | 19.02 | 19.15 | 80 | 19.3 | 1.47 | 1.47 |
| 06/03/15 | ULTA | SQZ | Y | 154.26 | 156.26 | 93 | 156.28 | 1.31 | 1.31 |
| 06/02/15 | BSET | SQZ | Y | 28.99 | 29.35 | 95 | 27.44 | -5.35 | 1.24 |
| 06/05/15 | JKS | CwH | Y | 30.38 | 30.72 | 85 | 30.72 | 1.12 | 1.12 |
| 06/01/15 | ATRC | SQZ | Y | 23.00 | 23.24 | 93 | 22.51 | -2.13 | 1.04 |
| 06/05/15 | CORI | HTF | N | 14.36 | 14.50 | 98 | 14.5 | 0.97 | 0.97 |
| 06/01/15 | FICO | SQZ | Y | 87.95 | 88.17 | 90 | 87.75 | -0.23 | 0.9 |
| 06/04/15 | RDI | SQZ | Y | 13.94 | 14.06 | 91 | 13.99 | 0.36 | 0.86 |
| 06/02/15 | ORLY | SQZ | Y | 222.38 | 222.9 | 87 | 222.09 | -0.13 | 0.83 |
| 06/05/15 | BANC | HTF | N | 13.60 | 13.71 | 86 | 13.71 | 0.81 | 0.81 |
| 06/03/15 | SUSQ | CwH | N | 14.00 | 14.02 | 83 | 14.09 | 0.64 | 0.64 |
| 06/02/15 | COR | SQZ | Y | 47.42 | 47.52 | 85 | 46.54 | -1.86 | 0.21 |
| 06/03/15 | GOGO | CwH | N | 22.50 | 22.50 | 86 | 22.22 | -1.24 | 0 |
| 06/04/15 | TEO | HSB | N | 20.38 | 20.38 | 27 | 19.93 | -2.21 | -0 |
| Weekly Average (68 breakouts) | 3.02 | 3.86 | |||||||
| *RS Rank on day before breakout. | |||||||||
* Volume on watchlist date >= 50 day average volume and gain >= 10%.
New
Volume Filter on Long Watchlists.
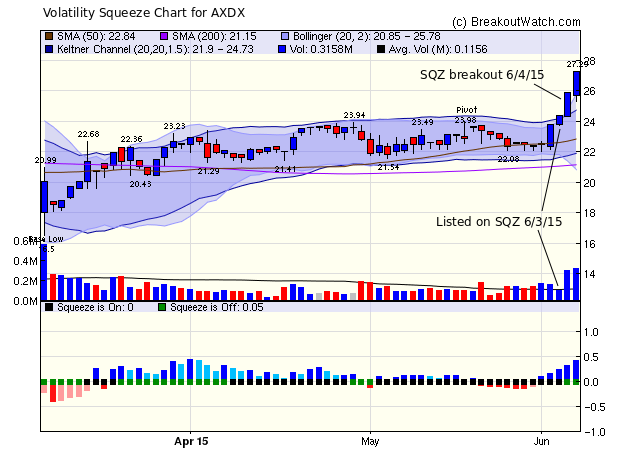
We have commented before (most recently 5/815) that a surge in volume accompanied by improving price before breakout can indicate a strong breakout to come). AXDX (see below) provides another example of this. To permit the easy recognition of above average volume, I've modified our watchlist filters to allow the selection of stocks with an above average volume on the date of their listing on the watchlist. Simply set the new filter to 'yes' and the watchlist (and alerts if you so specify) will be limited to those that have an equal or above average volume and improving price on the date the watchlist is published.
We have commented before (most recently 5/815) that a surge in volume accompanied by improving price before breakout can indicate a strong breakout to come). AXDX (see below) provides another example of this. To permit the easy recognition of above average volume, I've modified our watchlist filters to allow the selection of stocks with an above average volume on the date of their listing on the watchlist. Simply set the new filter to 'yes' and the watchlist (and alerts if you so specify) will be limited to those that have an equal or above average volume and improving price on the date the watchlist is published.
At
Least Average Volume on Watchlist Date Forecasts Strong Breakout
AXDX was list on our cup and handle pattern watchlist on 06/02/03 with a volume 1.6 times the 50 day average. The stock was also marked as being in a volatility squeeze. We issued an alert the next day, 06/03/15 at 10:27 and a price of 24.08. Although the stock closed above its pivot price we did not recognize it as a successful breakout because the volume failed to meet the 1.5 times ADV requirement.
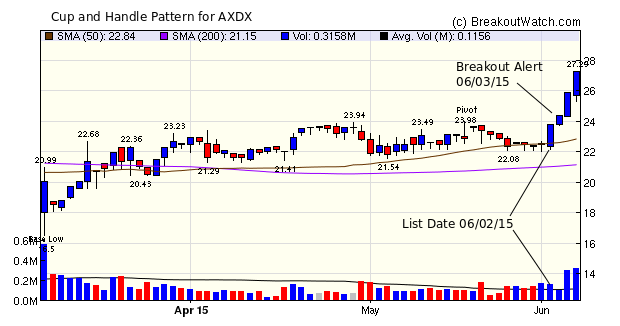
AXDX was list on our cup and handle pattern watchlist on 06/02/03 with a volume 1.6 times the 50 day average. The stock was also marked as being in a volatility squeeze. We issued an alert the next day, 06/03/15 at 10:27 and a price of 24.08. Although the stock closed above its pivot price we did not recognize it as a successful breakout because the volume failed to meet the 1.5 times ADV requirement.
However, the stock did not
rise to the point where the volatility squeeze came off, and
so it remained on our Volatility Squeeze (SQZ) watchlist on
06/03/15 for trading the next day.. We issued a SQZ alert on
06/04/15 at 09:53 and a price of 24.40.This time the volume
rose to almost 3 times ADV and the breakout was
confirmed.
If our new volume filter had
been available for these dates, then AXDX would have been
selected.
All of the stocks that gained at least 10% this week had a volume on the day before breakout at least equal to their average volume.
All of the stocks that gained at least 10% this week had a volume on the day before breakout at least equal to their average volume.
| Index | Value | Change Week | Change YTD | Trend | ||||||||||||||||||||||||||||||||||||
|---|---|---|---|---|---|---|---|---|---|---|---|---|---|---|---|---|---|---|---|---|---|---|---|---|---|---|---|---|---|---|---|---|---|---|---|---|---|---|---|---|
| Dow | 17849.5 | -0.9% | 0.15% | Down | ||||||||||||||||||||||||||||||||||||
| NASDAQ | 5068.46 | -0.03% | 7.02% | Up | ||||||||||||||||||||||||||||||||||||
| S&P 500 | 2092.83 | -0.69% | 1.65% | Up | ||||||||||||||||||||||||||||||||||||
1The Market Signal is derived
from our proprietary market model. The market model is
described on the site.
2The site also shows industry rankings based on fundamentals, combined technical and fundamentals, and on price alone. The site also shows daily industry movements. |
||||||||||||||||||||||||||||||||||||||||
|
Category
|
Symbol
|
Company Name
|
Expected Gain1
|
|---|---|---|---|
| Best Overall | PMFG | PMFG, Inc. | 111 |
| Top Technical | PMFG | PMFG, Inc. | 111 |
| Top Fundamental | MDXG | MiMedx Group, Inc | 84 |
| Top Tech. & Fund. | HQY | HealthEquity, Inc. | 62 |
|
Category
|
Symbol
|
Company Name
|
Expected Gain1
|
|---|---|---|---|
| Best Overall | SPCB | SuperCom, Ltd. | 78 |
| Top Technical | AAC | AAC Holdings, Inc. | 59 |
| Top Fundamental | AAC | AAC Holdings, Inc. | 59 |
| Top Tech. & Fund. | AAC | AAC Holdings, Inc. | 59 |
If you received this newsletter from a friend and you would like to receive it regularly please go to the BreakoutWatch.com site and enter as a Guest. You will then be able to register to receive the newsletter.
Copyright © 2015 NBIcharts, LLC dba BreakoutWatch.com. All rights
reserved.
" BreakoutWatch," the BreakoutWatch.com "eye" logo, and the slogan
"tomorrow's breakouts today" are service marks of NBIcharts LLC.
All other marks are the property of their respective owners, and
are used for descriptive purposes only.
BreakoutWatch is not affiliated with Investor's Business Daily or
with Mr. William O'Neil. Our site, research and analysis is
supported entirely by subscription and is free from advertising.