| Market Summary | Weekly Breakout Report | Top Breakout Choices | Top 2nd Chances | New Features | Tip of the Week |

The NASDAQ Composite set another new high on Tuesday but ended the week with a two times average volume decline leading to an overall loss for the week of 0.7%. The other two major indexes also lost ground for the week. Our trend indicators remain positive for the NASDAQ and are still negative for the DJI and S&P 500.
With the announcement that Greece will hold a referendum on July 5, the debt crisis is likely to continue unresolved next week and so continued market weakness can be expected.
Barry Ritholz' Blog frequently posts an enjoyable quote of the day, and today's I particularly enjoyed:
"Before
you speak, listen. Before you write, think. Before you spend,
earn. Before you invest, investigate. Before you criticize,
wait. Before you pray, forgive. Before you quit, try. Before
you retire, save. Before you die, give." -William A. Ward
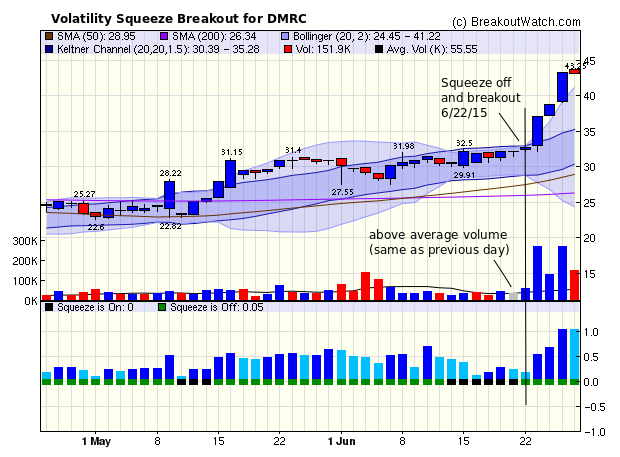
This was another strong week for breakouts although the negative trend towards the end of the week reduced overall gains. The top performer of the week provided another example our recent recommendation that the strongest breakouts come after a day of increasing volume and positive price movement.
| Breakouts for Week Beginning 06/22/15 | |||||||||
| Brkout Date | Symbol | Base | Squeeze | BrkoutOut Price | Brkout Day Close | RS Rank* | Last Close | Current % off BOP | Gain at Intraday High |
|---|---|---|---|---|---|---|---|---|---|
| 06/22/15 | DMRC | SQZ | Y | 32.15 | 32.69 | 91 | 43.17 | 34.28 | 34.53 |
| 06/24/15 | EFOI | CwH | N | 7.46 | 7.62 | 94 | 8.73 | 17.02 | 17.29 |
| 06/22/15 | EXAS | SQZ | Y | 29.32 | 30.69 | 93 | 30.02 | 2.39 | 6.28 |
| 06/22/15 | PTLA | CwH | N | 45.50 | 48.27 | 93 | 45.62 | 0.26 | 6.09 |
| 06/22/15 | TSEM | SQZ | Y | 16.03 | 17 | 88 | 15.835 | -1.22 | 6.05 |
| 06/22/15 | TGLS | CwH | N | 12.78 | 13.00 | 85 | 13.05 | 2.11 | 5.71 |
| 06/22/15 | GTS | SQZ | Y | 25.00 | 25.67 | 88 | 26 | 4.00 | 5.6 |
| 06/24/15 | CUTR | SQZ | Y | 15.12 | 15.64 | 92 | 15.61 | 3.24 | 5.49 |
| 06/24/15 | AFH | SQZ | Y | 19.29 | 19.57 | 85 | 20.295 | 5.21 | 5.29 |
| 06/22/15 | SSNI | CwH | N | 14.19 | 14.93 | 94 | 12.95 | -8.74 | 5.21 |
| 06/22/15 | BOFI | CwH | N | 102.16 | 102.68 | 86 | 106.49 | 4.24 | 4.36 |
| 06/23/15 | LPCN | CwH | N | 8.08 | 8.38 | 91 | 8.4 | 3.96 | 4.33 |
| 06/22/15 | GTIM | SQZ | Y | 9.50 | 9.9 | 97 | 9.25 | -2.63 | 4.21 |
| 06/22/15 | FICO | SQZ | Y | 90.46 | 92.23 | 90 | 94.05 | 3.97 | 4.06 |
| 06/22/15 | EYES | CwH | N | 15.67 | 15.79 | 84 | 14.63 | -6.64 | 3.89 |
| 06/22/15 | CORT | CwH | N | 6.93 | 7.16 | 98 | 5.985 | -13.64 | 3.32 |
| 06/25/15 | AAWW | SQZ | Y | 56.03 | 57.78 | 93 | 57.6 | 2.80 | 3.12 |
| 06/23/15 | FBR | SQZ | Y | 13.72 | 14.03 | 82 | 14.125 | 2.95 | 2.99 |
| 06/23/15 | CMRX | SQZ | Y | 45.11 | 46.18 | 93 | 46.23 | 2.48 | 2.66 |
| 06/26/15 | PLCE | SQZ | Y | 66.45 | 68.1 | 84 | 68.1 | 2.48 | 2.62 |
| 06/23/15 | EEFT | SQZ | Y | 60.97 | 62.17 | 81 | 62.5 | 2.51 | 2.58 |
| 06/22/15 | CHRS | CwH | N | 27.95 | 28.65 | 93 | 28.31 | 1.29 | 2.5 |
| 06/23/15 | CBPX | SQZ | Y | 23.38 | 23.96 | 93 | 21.93 | -6.20 | 2.48 |
| 06/26/15 | SPTN | SQZ | Y | 33.06 | 33.84 | 92 | 33.84 | 2.36 | 2.45 |
| 06/22/15 | FRED | CwH | N | 19.52 | 19.76 | 84 | 19.79 | 1.38 | 2.41 |
| 06/23/15 | KNL | CwH | N | 25.28 | 25.70 | 88 | 25.82 | 2.14 | 2.41 |
| 06/22/15 | HQH | SQZ | Y | 35.99 | 36.59 | 80 | 36.26 | 0.75 | 2.28 |
| 06/22/15 | FBT | SQZ | Y | 125.47 | 127.83 | 87 | 125 | -0.37 | 2.19 |
| 06/22/15 | TSRA | SQZ | Y | 38.80 | 39.49 | 87 | 38.32 | -1.24 | 2.09 |
| 06/22/15 | RM | SQZ | Y | 18.75 | 19.04 | 84 | 18.13 | -3.31 | 2.08 |
| 06/22/15 | TBI | SQZ | Y | 30.64 | 31.27 | 87 | 30.93 | 0.95 | 2.06 |
| 06/26/15 | CACC | SQZ | Y | 230.01 | 233.85 | 96 | 233.85 | 1.67 | 2.03 |
| 06/23/15 | IMMR | CwH | N | 12.63 | 12.72 | 90 | 12.52 | -0.87 | 1.98 |
| 06/23/15 | IIVI | SQZ | Y | 19.17 | 19.53 | 90 | 19.27 | 0.52 | 1.88 |
| 06/26/15 | JBT | SQZ | Y | 37.89 | 38.5 | 82 | 38.5 | 1.61 | 1.77 |
| 06/24/15 | LGIH | CwH | Y | 19.63 | 19.86 | 80 | 19.93 | 1.53 | 1.68 |
| 06/23/15 | MHLD | CwH | N | 15.57 | 15.60 | 85 | 15.79 | 1.41 | 1.67 |
| 06/23/15 | EXAS | SQZ | Y | 30.69 | 31 | 94 | 30.02 | -2.18 | 1.53 |
| 06/22/15 | NEWT | SQZ | Y | 18.03 | 18.3 | 99 | 17.85 | -1.00 | 1.5 |
| 06/25/15 | MBLY | CwH | N | 54.60 | 55.41 | 81 | 53.66 | -1.72 | 1.48 |
| 06/22/15 | HW | SQZ | Y | 19.55 | 19.81 | 92 | 18.99 | -2.86 | 1.48 |
| 06/25/15 | CCL | CwH | N | 49.92 | 50.04 | 82 | 50.645 | 1.45 | 1.46 |
| 06/25/15 | NXST | SQZ | Y | 57.22 | 57.73 | 82 | 57.9 | 1.19 | 1.36 |
| 06/26/15 | WWWW | SQZ | Y | 23.85 | 24.15 | 82 | 24.15 | 1.26 | 1.26 |
| 06/23/15 | JCOM | SQZ | Y | 69.40 | 70.23 | 82 | 69.75 | 0.50 | 1.2 |
| 06/23/15 | FDP | SQZ | Y | 39.63 | 40.1 | 81 | 39.54 | -0.23 | 1.19 |
| 06/23/15 | FDEF | SQZ | Y | 36.88 | 37.25 | 85 | 37.16 | 0.76 | 1.14 |
| 06/23/15 | TTPH | CwH | Y | 46.46 | 46.99 | 97 | 44.985 | -3.17 | 1.14 |
| 06/24/15 | ALDR | HTF | N | 49.27 | 49.82 | 99 | 45.68 | -7.29 | 1.12 |
| 06/22/15 | MTN | SQZ | Y | 108.43 | 109.61 | 86 | 109.36 | 0.86 | 1.09 |
| 06/23/15 | DHT | CwH | Y | 8.38 | 8.47 | 82 | 8.09 | -3.46 | 1.07 |
| 06/26/15 | DPZ | CwH | N | 113.86 | 115.01 | 90 | 115.01 | 1.01 | 1.01 |
| 06/26/15 | OPHT | SQZ | Y | 51.59 | 51.92 | 82 | 51.92 | 0.64 | 0.97 |
| 06/26/15 | IIVI | SQZ | Y | 19.09 | 19.27 | 90 | 19.27 | 0.94 | 0.94 |
| 06/22/15 | HCCI | CwH | N | 15.69 | 15.83 | 83 | 15.2 | -3.12 | 0.89 |
| 06/22/15 | USCR | SQZ | Y | 40.25 | 40.27 | 94 | 39.455 | -1.98 | 0.67 |
| 06/23/15 | DOOR | SQZ | Y | 70.94 | 71.39 | 82 | 70.88 | -0.08 | 0.63 |
| 06/23/15 | TLMR | CwH | N | 17.08 | 17.18 | 83 | 16.99 | -0.53 | 0.59 |
| 06/26/15 | ATSG | SQZ | Y | 10.53 | 10.56 | 87 | 10.56 | 0.28 | 0.57 |
| 06/25/15 | HLF | CwH | Y | 54.80 | 55.05 | 87 | 53.89 | -1.66 | 0.46 |
| 06/26/15 | MMS | SQZ | Y | 67.09 | 67.31 | 91 | 67.31 | 0.33 | 0.45 |
| 06/26/15 | NXST | SQZ | Y | 57.83 | 57.9 | 80 | 57.9 | 0.12 | 0.29 |
| 06/25/15 | GOGO | CwH | N | 23.10 | 23.16 | 84 | 22.62 | -2.08 | 0.26 |
| 06/23/15 | LULU | CwH | N | 68.62 | 68.80 | 90 | 67.1 | -2.22 | 0.26 |
| 06/26/15 | PGC | CwH | N | 22.83 | 22.87 | 80 | 22.87 | 0.18 | 0.22 |
| 06/26/15 | USNA | SQZ | Y | 137.84 | 138 | 95 | 138 | 0.12 | 0.22 |
| 06/23/15 | RHT | SQZ | Y | 79.49 | 79.62 | 89 | 77.49 | -2.52 | 0.16 |
| Weekly Average (68 breakouts) | 1.04 | 3.37 | |||||||
| *RS Rank on day before breakout. | |||||||||
No new features this week.
Updated Recommendations for Cup and Handle Chart Pattern Breakouts
Following last week's analysis of the importance of above average volume and positive price movement on the day before breakout, I am updating my recommendations for trading Cup and Handle chart pattern breakouts, last published on 4/25/15 as follows:
For the optimal return (best profit at least risk) from breakouts from our cup with handle watchlist, I now recommend the following trading strategy:
- Each day, create a personal watchlist of stocks that satisfy
- RS Rank must be at least 90
- Industry Rank must be in the top 60 percentile (i.e. have a rank less than 135 in our industry ranking scheme)
- Average daily volume >= 100,000.
- Previous day volume should be above the 50 day average and price must have moved up
- Buy on alert (or by placing a stop market order at the breakout price).
- Sell at next open if volume at end of breakout day is less than 1.75 times average 50 day volume
- Sell if stock drops 6% or more from the breakout price.
- After purchase, set a 4% trailing stop by monitoring daily high's and setting a stop loss at 4% of the maximum high after breakout. Adjust daily if necessary.
- Sell if trailing stop met intraday. (use a sell stop order).
| Index | Value | Change Week | Change YTD | Trend | ||||||||||||||||||||||||||||||||||||
|---|---|---|---|---|---|---|---|---|---|---|---|---|---|---|---|---|---|---|---|---|---|---|---|---|---|---|---|---|---|---|---|---|---|---|---|---|---|---|---|---|
| Dow | 17946.7 | -0.38% | 0.69% | Down | ||||||||||||||||||||||||||||||||||||
| NASDAQ | 5080.5 | -0.71% | 7.27% | Up | ||||||||||||||||||||||||||||||||||||
| S&P 500 | 2101.49 | -0.4% | 2.07% | Down | ||||||||||||||||||||||||||||||||||||
1The Market Signal is derived
from our proprietary market model. The market model is
described on the site.
2The site also shows industry rankings based on fundamentals, combined technical and fundamentals, and on price alone. The site also shows daily industry movements. |
||||||||||||||||||||||||||||||||||||||||
|
Category
|
Symbol
|
Company Name
|
Expected Gain1
|
|---|---|---|---|
| Best Overall | GLUU | Glu Mobile Inc. | 103 |
| Top Technical | GLUU | Glu Mobile Inc. | 103 |
| Top Fundamental | ANET | Arista Networks, Inc. | 30 |
| Top Tech. & Fund. | ANET | Arista Networks, Inc. | 30 |
|
Category
|
Symbol
|
Company Name
|
Expected Gain1
|
|---|---|---|---|
| Best Overall | DHT | DHT Holdings, Inc. | 89 |
| Top Technical | BOFI | BofI Holding, Inc. | 36 |
| Top Fundamental | MHLD | Maiden Holdings, Ltd. | 0 |
| Top Tech. & Fund. | BOFI | BofI Holding, Inc. | 36 |
If you received this newsletter from a friend and you would like to receive it regularly please go to the BreakoutWatch.com site and enter as a Guest. You will then be able to register to receive the newsletter.
Copyright © 2015 NBIcharts, LLC dba BreakoutWatch.com. All rights
reserved.
" BreakoutWatch," the BreakoutWatch.com "eye" logo, and the slogan
"tomorrow's breakouts today" are service marks of NBIcharts LLC.
All other marks are the property of their respective owners, and
are used for descriptive purposes only.
BreakoutWatch is not affiliated with Investor's Business Daily or
with Mr. William O'Neil. Our site, research and analysis is
supported entirely by subscription and is free from advertising.