| Market Summary | Weekly Breakout Report | Top Breakout Choices | Top 2nd Chances | New Features | Tip of the Week |
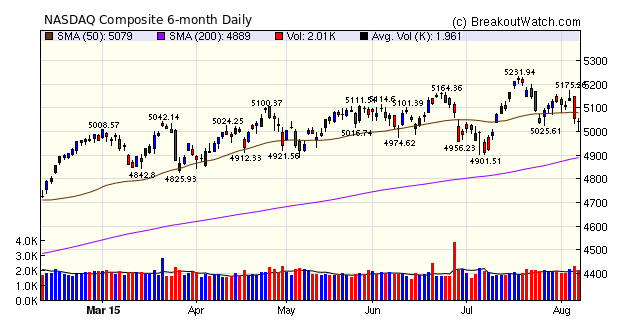
Since making its most recent high on July 20, the NASDAQ has fallen below its 50 day moving level twice. Should it rally above that level but fail to reach Thursday's high of 5175, then it will qualify as being a short sale possibility.
Although earnings reports have been mixed, the economic news is generally positive and Friday's jobs report was in-line with expectations. Analysts believe this increases the likelihood that the Fed will raise interest rates at their September meeting so we are likely seeing stock prices adjust lower in anticipation of tightening of liquidity.
Unsurprisingly, our market trend signal for the DJI remains negative after 7 successive losing days, while the S&P 500 and NASDAQ Composite trends remain positive, although as noted above, this may change soon enough and so caution is advised.
The number of weekly breakouts fell to 25 and as can be seen, only 2 had gains in double figures by week's close. While profitable breakouts can still occur as the market consolidates, opportunities will carry greater risk.
| Breakouts for Week Beginning 08/03/15 | |||||||||
| Brkout Date | Symbol | Base | Squeeze | BrkoutOut Price | Brkout Day Close | RS Rank* | Last Close | Current % off BOP | Gain at Intraday High |
|---|---|---|---|---|---|---|---|---|---|
| 08/04/15 | AMSG | SQZ | Y | 71.68 | 73.27 | 92 | 82.44 | 15.01 | 17.93 |
| 08/05/15 | TSE | DB | N | 26.60 | 27.18 | 95 | 29.49 | 10.86 | 12.18 |
| 08/03/15 | MRNS | HTF | N | 17.38 | 17.41 | 98 | 17.84 | 2.65 | 11.51 |
| 08/04/15 | MRNS | HTF | N | 17.48 | 19.38 | 98 | 17.84 | 2.06 | 10.87 |
| 08/05/15 | RGR | CwH | Y | 60.86 | 62.75 | 90 | 63.14 | 3.75 | 8.53 |
| 08/06/15 | HLF | CwH | N | 55.86 | 57.56 | 88 | 59.68 | 6.84 | 6.84 |
| 08/07/15 | CCRN | CwH | N | 13.19 | 13.98 | 94 | 13.98 | 5.99 | 5.99 |
| 08/03/15 | DENN | CwH | N | 12.09 | 12.60 | 91 | 12.42 | 2.73 | 5.05 |
| 08/04/15 | EXEL | HTF | N | 6.31 | 6.62 | 99 | 5.9 | -6.50 | 4.91 |
| 08/05/15 | JCOM | CwH | N | 71.06 | 74.28 | 86 | 74.11 | 4.29 | 4.53 |
| 08/04/15 | AET | SQZ | Y | 113.60 | 115.19 | 89 | 116.39 | 2.46 | 3.93 |
| 08/03/15 | NICE | SQZ | Y | 64.54 | 65.4 | 94 | 66.53 | 3.08 | 3.56 |
| 08/05/15 | BSFT | SQZ | Y | 35.35 | 36.32 | 90 | 34.23 | -3.17 | 2.74 |
| 08/07/15 | BR | CwH | N | 54.67 | 56.05 | 82 | 56.05 | 2.52 | 2.52 |
| 08/05/15 | AET | SQZ | Y | 115.19 | 118.07 | 89 | 116.39 | 1.04 | 2.5 |
| 08/04/15 | VMC | CwH | N | 95.23 | 96.05 | 89 | 94.51 | -0.76 | 2.31 |
| 08/03/15 | PRE | CwH | N | 136.10 | 139.20 | 84 | 137.8 | 1.25 | 2.28 |
| 08/05/15 | CALM | SQZ | Y | 55.70 | 56.89 | 95 | 54.54 | -2.08 | 2.14 |
| 08/03/15 | TDS | DB | N | 29.48 | 30.05 | 81 | 29.3 | -0.61 | 1.93 |
| 08/03/15 | LABL | SQZ | Y | 63.76 | 63.8 | 86 | 64.65 | 1.40 | 1.85 |
| 08/05/15 | CSOD | CwH | N | 37.54 | 38.03 | 84 | 36.39 | -3.06 | 1.31 |
| 08/06/15 | HR | HSB | N | 24.14 | 24.25 | 35 | 24.38 | 0.99 | 0.99 |
| 08/03/15 | INGN | SQZ | Y | 44.47 | 44.83 | 97 | 43.39 | -2.43 | 0.81 |
| 08/05/15 | SKYW | CwH | N | 17.12 | 17.24 | 93 | 17.09 | -0.18 | 0.7 |
| 08/06/15 | LABL | SQZ | Y | 64.82 | 64.94 | 88 | 64.65 | -0.26 | 0.19 |
| Weekly Average (25 breakouts) | 1.84 | 0.7 | |||||||
| *RS Rank on day before breakout. | |||||||||
No new features this week.
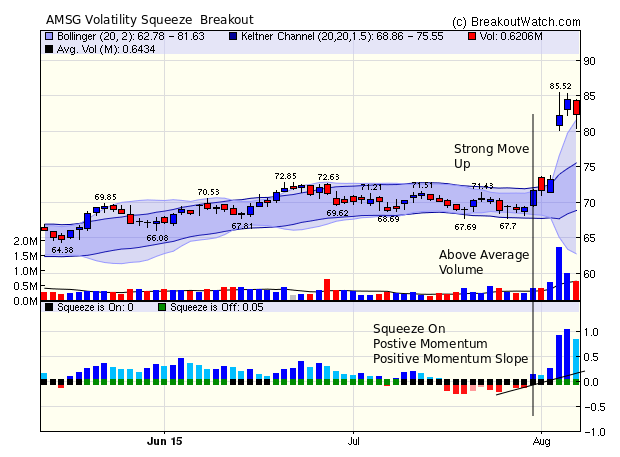
Use Above Average Volume Filter to Identify Possible Strong Breakouts
Our top performing breakout this week came from our Volatility Squeeze watchlist. The breakout came on Wednesday as the stock gapped up. The gap up of 10% put it well outside our recommended 5% limit so there was little opportunity to capture the 17% gain on breakout day, but an astute reading of the chart would have allowed an entry on Monday. The chart below shows that on Friday, July 31, the stock qualified for our Volatility Squeeze watchlist and the stock was setting up for a possible breakout to come.
Use of our Above Average Volume filter (described here) on the watchlist on July 31 would have selected AMSG and the trade could have been entered at Monday's open.
| Index | Value | Change Week | Change YTD | Trend | ||||||||||||||||||||||||||||||||||||
|---|---|---|---|---|---|---|---|---|---|---|---|---|---|---|---|---|---|---|---|---|---|---|---|---|---|---|---|---|---|---|---|---|---|---|---|---|---|---|---|---|
| Dow | 17373.4 | -1.79% | -2.52% | Down | ||||||||||||||||||||||||||||||||||||
| NASDAQ | 5043.54 | -1.65% | 6.49% | Up | ||||||||||||||||||||||||||||||||||||
| S&P 500 | 2077.57 | -1.25% | 0.91% | Up | ||||||||||||||||||||||||||||||||||||
1The Market Signal is derived
from our proprietary market model. The market model is
described on the site.
2The site also shows industry rankings based on fundamentals, combined technical and fundamentals, and on price alone. The site also shows daily industry movements. |
||||||||||||||||||||||||||||||||||||||||
|
Category
|
Symbol
|
Company Name
|
Expected Gain1
|
|---|---|---|---|
| Best Overall | TNK | Teekay Tankers Ltd. | 98 |
| Top Technical | TNK | Teekay Tankers Ltd. | 98 |
| Top Fundamental | MOH | Molina Healthcare Inc | 31 |
| Top Tech. & Fund. | MOH | Molina Healthcare Inc | 31 |
|
Category
|
Symbol
|
Company Name
|
Expected Gain1
|
|---|---|---|---|
| Best Overall | DENN | Denny's Corporation | 68 |
| Top Technical | DENN | Denny's Corporation | 68 |
| Top Fundamental | DENN | Denny's Corporation | 68 |
| Top Tech. & Fund. | DENN | Denny's Corporation | 68 |
If you received this newsletter from a friend and you would like to receive it regularly please go to the BreakoutWatch.com site and enter as a Guest. You will then be able to register to receive the newsletter.
Copyright © 2015 NBIcharts, LLC dba BreakoutWatch.com. All rights
reserved.
" BreakoutWatch," the BreakoutWatch.com "eye" logo, and the slogan
"tomorrow's breakouts today" are service marks of NBIcharts LLC.
All other marks are the property of their respective owners, and
are used for descriptive purposes only.
BreakoutWatch is not affiliated with Investor's Business Daily or
with Mr. William O'Neil. Our site, research and analysis is
supported entirely by subscription and is free from advertising.