| Market Summary | Weekly Breakout Report | Top Breakout Choices | Top 2nd Chances | New Features | Tip of the Week |
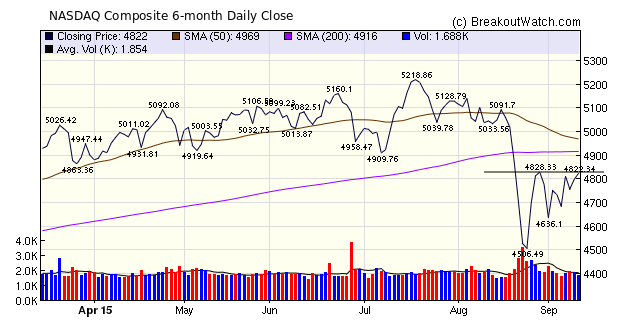
As a note to new subscribers, I always focus on the NASDAQ Composite in this section as it is from this index that the most successful breakouts occur.
The index rose almost 3% this week to provide the best performance of the three major indexes. Our market trend indicator remains negative, however, which in the past has always correlated with a lower number of successful breakouts, so caution is still advised.
The index closed at 4822 and faces resistance at 4828. Expect a breakthrough if the Fed holds off on rate increases on Wednesday. Speculation that that will be the outcome of next week's meeting, may generate a move higher earlier in the week.

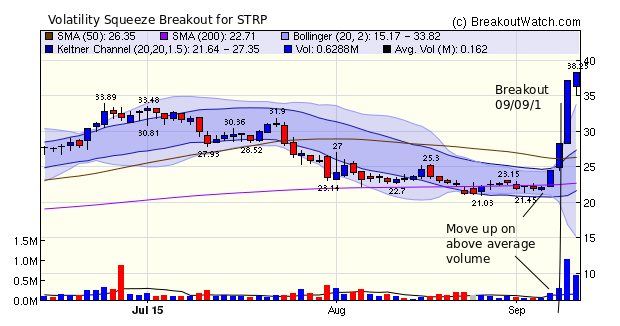
Volatility Squeeze breakouts dominated this week with 20 out of 23 breakouts. The top 4, STRP, CNCE, REPH and TXMD, all signaled they could possibly breakout with a move higher on above average volume on the day before breakout. Thia is a characteristic of successful breakouts that I have frequently stressed in recent weeks.
| Breakouts for Week Beginning 09/07/15 | |||||||||
| Brkout Date | Symbol | Base | Squeeze | BrkoutOut Price | Brkout Day Close | RS Rank* | Last Close | Current % off BOP | Gain at Intraday High |
|---|---|---|---|---|---|---|---|---|---|
| 09/09/15 | STRP | SQZ | Y | 24.46 | 28.31 | 96 | 38.25 | 56.38 | 56.38 |
| 09/09/15 | CNCE | SQZ | Y | 16.60 | 17.96 | 95 | 19.27 | 16.08 | 16.08 |
| 09/08/15 | REPH | SQZ | Y | 14.69 | 15.86 | 99 | 16.89 | 14.98 | 14.98 |
| 09/09/15 | TXMD | SQZ | Y | 6.59 | 6.6 | 90 | 7.33 | 11.23 | 11.23 |
| 09/09/15 | REPH | SQZ | Y | 15.85 | 15.97 | 99 | 16.89 | 6.56 | 6.56 |
| 09/08/15 | SIGM | SQZ | Y | 10.30 | 10.88 | 98 | 8.69 | -15.63 | 5.63 |
| 09/11/15 | INCY | CwH | N | 124.80 | 131.01 | 98 | 131.01 | 4.98 | 4.98 |
| 09/10/15 | MPAA | SQZ | Y | 31.91 | 32.6 | 82 | 32.9 | 3.10 | 3.1 |
| 09/11/15 | NUVA | SQZ | Y | 52.51 | 54.05 | 91 | 54.05 | 2.93 | 2.93 |
| 09/09/15 | FLML | SQZ | Y | 22.86 | 23.04 | 96 | 23.52 | 2.89 | 2.89 |
| 09/08/15 | STBZ | SQZ | Y | 20.20 | 20.74 | 82 | 20.49 | 1.44 | 2.67 |
| 09/09/15 | SFNC | SQZ | Y | 45.86 | 46.43 | 84 | 46.56 | 1.53 | 2.4 |
| 09/08/15 | CYTK | SQZ | Y | 7.22 | 7.38 | 96 | 7.31 | 1.25 | 2.35 |
| 09/09/15 | DMRC | SQZ | Y | 38.91 | 39.68 | 97 | 35.96 | -7.58 | 1.98 |
| 09/11/15 | NCI | SQZ | Y | 15.35 | 15.65 | 82 | 15.65 | 1.95 | 1.95 |
| 09/11/15 | CCS | CwH | Y | 23.06 | 23.39 | 91 | 23.39 | 1.43 | 1.43 |
| 09/11/15 | RUTH | SQZ | Y | 16.16 | 16.37 | 91 | 16.37 | 1.30 | 1.3 |
| 09/11/15 | CBZ | SQZ | Y | 9.97 | 10.09 | 88 | 10.09 | 1.20 | 1.2 |
| 09/10/15 | JAKK | SQZ | Y | 9.86 | 9.92 | 96 | 9.92 | 0.61 | 0.61 |
| 09/09/15 | BFIN | SQZ | Y | 12.14 | 12.15 | 80 | 12.2 | 0.49 | 0.49 |
| 09/11/15 | FIZZ | CwH | N | 28.22 | 28.31 | 95 | 28.31 | 0.32 | 0.32 |
| 09/10/15 | DEG | SQZ | Y | 22.66 | 22.67 | 88 | 22.63 | -0.13 | 0.04 |
| 09/09/15 | ABIO | SQZ | Y | 6.64 | 6.64 | 83 | 6.4 | -3.61 | -0 |
| Weekly Average (23 breakouts) | 4.51 | 6.15 | |||||||
| *RS Rank on day before breakout. | |||||||||
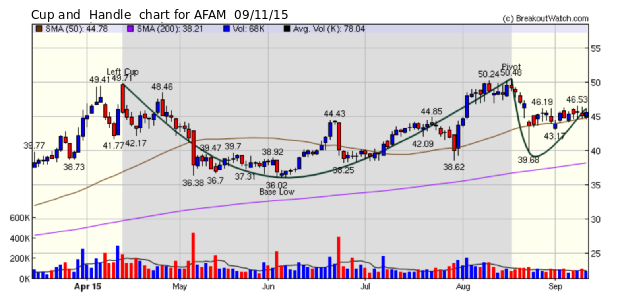
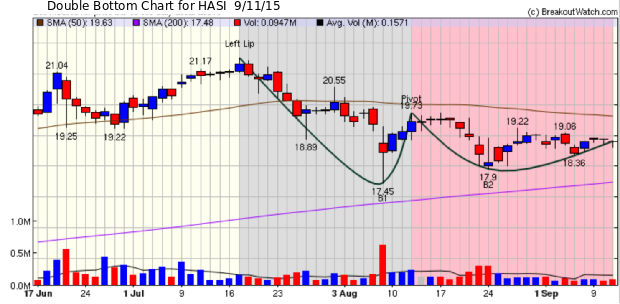
I've added a new annotation to cup and handle and double bottom charts that clearly shows how our algorithms recognized each of these patterns. This should make it easier for subscribers to visualize the patterns,which in some cases could be quite obscure.
The new annotations are shown when you click on a symbol in the CwH and DB watchlists, they are not yet available in the chart browser.
The shape of the the cup and the shape of the handle should now be easier to recognize as shown here.

The double bottom pattern also becomes clearer as in this example for HASI

Current market conditions clearly favor the Volatility Squeeze pattern as this weeks breakouts show. This is not a pattern that was recognized by O'Neil in How to Make Money in Stocks, but it is one that has proven to be quite profitable, ranking just behind the cup and handle pattern, in our performance rankings. I developed it originally as a complement to the cup and handle, as research showed that a handle that was also in a volatility squeeze performed particularly well on breakout day (see http://www.breakoutwatch.com/newsletter/archive/2015-04-11.php#6, and then developed it as a stand-alone pattern.
The derivation of the pattern is described on the methodology tab on the Volatility Squeeze watchlist (http://www.breakoutwatch.com/watchlists/html/SQZ_meth.html).
This week's breakout of STRP shows how powerful this pattern can be.

| Index | Value | Change Week | Change YTD | Trend | ||||||||||||||||||||||||||||||||||||
|---|---|---|---|---|---|---|---|---|---|---|---|---|---|---|---|---|---|---|---|---|---|---|---|---|---|---|---|---|---|---|---|---|---|---|---|---|---|---|---|---|
| Dow | 16433.1 | 2.05% | -7.8% | Down | ||||||||||||||||||||||||||||||||||||
| NASDAQ | 4822.34 | 2.96% | 1.82% | Down | ||||||||||||||||||||||||||||||||||||
| S&P 500 | 1961.05 | 2.07% | -4.75% | Down | ||||||||||||||||||||||||||||||||||||
1The Market Signal is derived
from our proprietary market model. The market model is
described on the site.
2The site also shows industry rankings based on fundamentals, combined technical and fundamentals, and on price alone. The site also shows daily industry movements. |
||||||||||||||||||||||||||||||||||||||||
|
Category
|
Symbol
|
Company Name
|
Expected Gain1
|
|---|---|---|---|
| Best Overall | NEO | NeoGenomics, Inc. | 96 |
| Top Technical | NEO | NeoGenomics, Inc. | 96 |
| Top Fundamental | PAYC | Paycom Software, Inc. | 50 |
| Top Tech. & Fund. | PAYC | Paycom Software, Inc. | 50 |
|
Category
|
Symbol
|
Company Name
|
Expected Gain1
|
|---|---|---|---|
| Best Overall | CCS | Century Communities, Inc. | 57 |
| Top Technical | CCS | Century Communities, Inc. | 57 |
| Top Fundamental | CCS | Century Communities, Inc. | 57 |
| Top Tech. & Fund. | CCS | Century Communities, Inc. | 57 |
If you received this newsletter from a friend and you would like to receive it regularly please go to the BreakoutWatch.com site and enter as a Guest. You will then be able to register to receive the newsletter.
Copyright © 2015 NBIcharts, LLC dba BreakoutWatch.com. All rights
reserved.
" BreakoutWatch," the BreakoutWatch.com "eye" logo, and the slogan
"tomorrow's breakouts today" are service marks of NBIcharts LLC.
All other marks are the property of their respective owners, and
are used for descriptive purposes only.
BreakoutWatch is not affiliated with Investor's Business Daily or
with Mr. William O'Neil. Our site, research and analysis is
supported entirely by subscription and is free from advertising.