| Market Summary | Weekly Breakout Report | Top Breakout Choices | Top 2nd Chances | New Features | Tip of the Week |
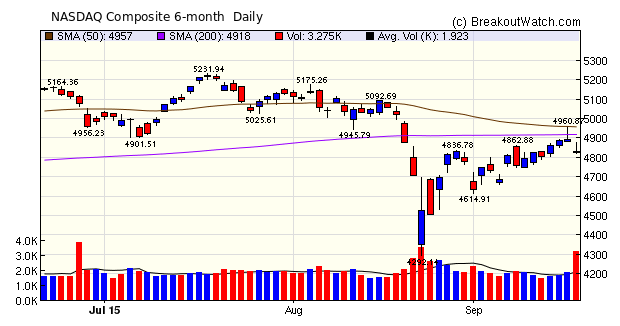
The week began with the markets moving higher on the expectation that the FOMC would hold interest rates steady. This was confirmed on Thursday but delivered only a brief respite before fears emerged that Janet Yellen may yet become the "Grinch" who stole Christmas. At her press conference, Yellen maintained that FOMC members are still looking to raise rates before the year ends. So rate uncertainty remains and the markets tumbled on Friday on double the average volume ahead of new elections in Greece to take place on Sunday which could threaten the Eurozone bailout agreement.
The NASDAQ composite did maintain a slight gain for the week but our market trend indicators continue to point down.
Volatility Squeeze (SQZ) breakouts again dominated this week with 34 out of 46 breakouts. The cup and handle pattern (CWH) contributed only 8. There was bne High Tight Flag (HTF) breakout and three Head and Shoulders Bottoms (HSB).
| Breakouts for Week Beginning 09/14/15 | |||||||||
| Brkout Date | Symbol | Base | Squeeze | BrkoutOut Price | Brkout Day Close | RS Rank* | Last Close | Current % off BOP | Gain at Intraday High |
|---|---|---|---|---|---|---|---|---|---|
| 09/16/15 | QURE | SQZ | Y | 28.16 | 28.85 | 97 | 33.41 | 18.64 | 18.64 |
| 09/17/15 | IMGN | SQZ | Y | 14.43 | 16.36 | 95 | 14.65 | 1.52 | 13.37 |
| 09/15/15 | TRVN | HTF | N | 11.94 | 12.12 | 99 | 13.3 | 11.39 | 11.39 |
| 09/14/15 | SRPT | SQZ | Y | 35.97 | 36.77 | 99 | 39.93 | 11.01 | 11.04 |
| 09/14/15 | IPHI | SQZ | Y | 23.79 | 24.38 | 95 | 24.64 | 3.57 | 7.15 |
| 09/18/15 | VNR | HSB | N | 9.23 | 9.86 | 6 | 9.86 | 6.83 | 6.83 |
| 09/18/15 | ADHD | SQZ | Y | 7.80 | 8.26 | 91 | 8.26 | 5.90 | 5.9 |
| 09/17/15 | XNCR | SQZ | Y | 18.39 | 19.45 | 93 | 18.69 | 1.63 | 5.76 |
| 09/17/15 | HUBS | CwH | N | 49.07 | 50.58 | 90 | 51.65 | 5.26 | 5.26 |
| 09/14/15 | PATK | CwH | N | 44.95 | 47.27 | 96 | 46.51 | 3.47 | 5.16 |
| 09/15/15 | LMAT | SQZ | Y | 13.60 | 14.06 | 98 | 14.3 | 5.15 | 5.15 |
| 09/16/15 | NPTN | SQZ | Y | 7.36 | 7.37 | 97 | 7.68 | 4.35 | 4.35 |
| 09/18/15 | LDRH | SQZ | Y | 39.86 | 41.42 | 85 | 41.42 | 3.91 | 3.91 |
| 09/16/15 | BABA | HSB | N | 64.91 | 67.23 | 15 | 65.75 | 1.29 | 3.57 |
| 09/16/15 | RTEC | SQZ | Y | 12.64 | 13.09 | 87 | 12.68 | 0.32 | 3.56 |
| 09/18/15 | XON | SQZ | Y | 48.46 | 49.91 | 97 | 49.91 | 2.99 | 2.99 |
| 09/18/15 | HZNP | SQZ | Y | 31.17 | 31.94 | 98 | 31.94 | 2.47 | 2.6 |
| 09/16/15 | OWW | CwH | N | 11.62 | 11.92 | 87 | 65.75 | N/A | 2.58 |
| 09/17/15 | CVT | SQZ | Y | 32.65 | 33.12 | 92 | 33.49 | 2.57 | 2.57 |
| 09/16/15 | BAH | SQZ | Y | 27.04 | 27.32 | 81 | 27.71 | 2.48 | 2.51 |
| 09/18/15 | CEMP | SQZ | Y | 37.46 | 38.4 | 98 | 38.4 | 2.51 | 2.51 |
| 09/18/15 | PSEM | CwH | N | 16.95 | 17.34 | 95 | 17.34 | 2.30 | 2.3 |
| 09/18/15 | NPTN | SQZ | Y | 7.51 | 7.68 | 97 | 7.68 | 2.26 | 2.26 |
| 09/18/15 | BLUE | SQZ | Y | 138.04 | 141.14 | 98 | 141.14 | 2.25 | 2.25 |
| 09/17/15 | HSKA | SQZ | Y | 34.42 | 35.15 | 98 | 34.39 | -0.09 | 2.12 |
| 09/18/15 | LMAT | SQZ | Y | 14.04 | 14.3 | 98 | 14.3 | 1.85 | 1.85 |
| 09/18/15 | BBW | SQZ | Y | 19.93 | 20.26 | 90 | 20.26 | 1.66 | 1.66 |
| 09/16/15 | NBIX | CwH | N | 54.09 | 54.29 | 99 | 54.9 | 1.50 | 1.55 |
| 09/17/15 | BAH | SQZ | Y | 27.33 | 27.72 | 80 | 27.71 | 1.39 | 1.43 |
| 09/17/15 | LABL | SQZ | Y | 67.27 | 68.15 | 91 | 67.64 | 0.55 | 1.31 |
| 09/17/15 | TSRO | CwH | N | 57.48 | 58.00 | 95 | 58.13 | 1.13 | 1.13 |
| 09/18/15 | CVT | SQZ | Y | 33.12 | 33.49 | 93 | 33.49 | 1.12 | 1.12 |
| 09/18/15 | DYAX | SQZ | Y | 24.76 | 24.99 | 97 | 24.99 | 0.93 | 0.93 |
| 09/17/15 | KALU | SQZ | Y | 84.12 | 84.84 | 82 | 84.29 | 0.20 | 0.86 |
| 09/18/15 | CMRX | SQZ | Y | 51.03 | 51.41 | 96 | 51.41 | 0.74 | 0.74 |
| 09/18/15 | RAS | HSB | N | 5.49 | 5.53 | 23 | 5.53 | 0.73 | 0.73 |
| 09/18/15 | ADMS | SQZ | Y | 20.98 | 21.13 | 84 | 21.13 | 0.71 | 0.71 |
| 09/18/15 | KITE | CwH | N | 65.56 | 65.94 | 96 | 65.94 | 0.58 | 0.58 |
| 09/17/15 | SHEN | SQZ | Y | 40.68 | 40.89 | 96 | 39.33 | -3.32 | 0.52 |
| 09/18/15 | RUTH | SQZ | Y | 16.59 | 16.67 | 90 | 16.67 | 0.48 | 0.48 |
| 09/18/15 | CHUY | SQZ | Y | 31.11 | 31.23 | 93 | 31.23 | 0.39 | 0.39 |
| 09/15/15 | CYTK | CwH | N | 7.76 | 7.76 | 95 | 7.51 | -3.22 | 0.39 |
| 09/16/15 | KYTH | SQZ | Y | 74.81 | 74.87 | 98 | 74.92 | 0.15 | 0.15 |
| 09/18/15 | MSEX | SQZ | Y | 23.17 | 23.2 | 83 | 23.2 | 0.13 | 0.13 |
| 09/17/15 | NAVG | SQZ | Y | 77.83 | 77.86 | 80 | 76.74 | -1.40 | 0.04 |
| 09/18/15 | TTWO | SQZ | Y | 29.52 | 29.53 | 87 | 29.53 | 0.03 | 0.03 |
| Weekly Average (46 breakouts) | 2.4 | 3.31 | |||||||
| *RS Rank on day before breakout. | |||||||||
No new features this week.
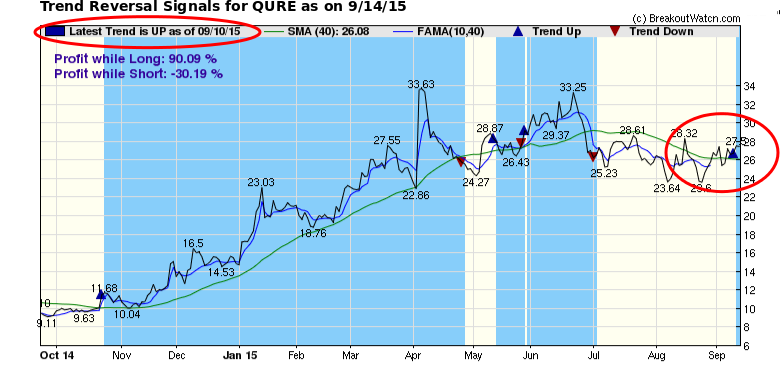
Use our Trend Indicator Tool on any Stock Symbol
Did you know you can learn the latest trend of any stock in our dataabase?
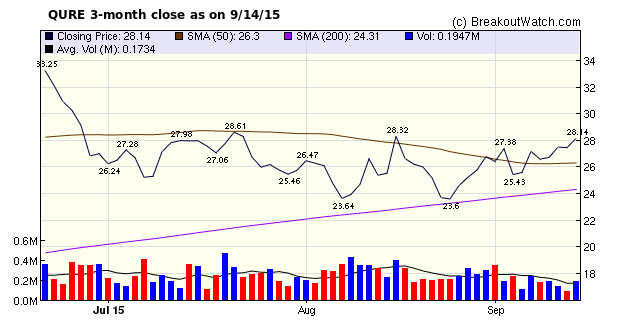
Suppose, for example, you were contemplating taking a position in QURE, (our top breakout this week) when it appeared on our Volatility Squeeze watchlist on 9/14, the day before breakout. If you looked at a 3-month closing price chart, you would have seen a stock moving sideways, with a possible slight upward trend.
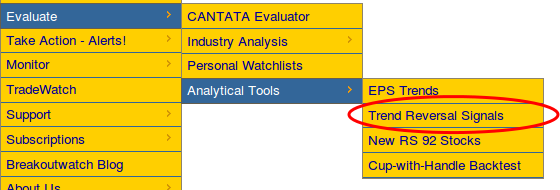
The Trend Reversal Signals tool is accessed from the Analytical Tools Menu.
| Index | Value | Change Week | Change YTD | Trend | ||||||||||||||||||||||||||||||||||||
|---|---|---|---|---|---|---|---|---|---|---|---|---|---|---|---|---|---|---|---|---|---|---|---|---|---|---|---|---|---|---|---|---|---|---|---|---|---|---|---|---|
| Dow | 16384.6 | -0.3% | -8.07% | Down | ||||||||||||||||||||||||||||||||||||
| NASDAQ | 4827.23 | 0.1% | 1.93% | Down | ||||||||||||||||||||||||||||||||||||
| S&P 500 | 1958.03 | -0.15% | -4.9% | Down | ||||||||||||||||||||||||||||||||||||
1The Market Signal is derived
from our proprietary market model. The market model is
described on the site.
2The site also shows industry rankings based on fundamentals, combined technical and fundamentals, and on price alone. The site also shows daily industry movements. |
||||||||||||||||||||||||||||||||||||||||
|
Category
|
Symbol
|
Company Name
|
Expected Gain1
|
|---|---|---|---|
| Best Overall | TXMD | TherapeuticsMD, Inc. | 108 |
| Top Technical | TXMD | TherapeuticsMD, Inc. | 108 |
| Top Fundamental | PAYC | Paycom Software, Inc. | 55 |
| Top Tech. & Fund. | PAYC | Paycom Software, Inc. | 55 |
|
Category
|
Symbol
|
Company Name
|
Expected Gain1
|
|---|---|---|---|
| Best Overall | PSEM | Pericom Semiconductor Corporation | 58 |
| Top Technical | PATK | Patrick Industries, Inc. | 43 |
| Top Fundamental | PATK | Patrick Industries, Inc. | 43 |
| Top Tech. & Fund. | PATK | Patrick Industries, Inc. | 43 |
If you received this newsletter from a friend and you would like to receive it regularly please go to the BreakoutWatch.com site and enter as a Guest. You will then be able to register to receive the newsletter.
Copyright © 2015 NBIcharts, LLC dba BreakoutWatch.com. All rights
reserved.
" BreakoutWatch," the BreakoutWatch.com "eye" logo, and the slogan
"tomorrow's breakouts today" are service marks of NBIcharts LLC.
All other marks are the property of their respective owners, and
are used for descriptive purposes only.
BreakoutWatch is not affiliated with Investor's Business Daily or
with Mr. William O'Neil. Our site, research and analysis is
supported entirely by subscription and is free from advertising.