| Market Summary | Weekly Breakout Report | Top Breakout Choices | Top 2ND Chances | New Features | Tip of the Week |
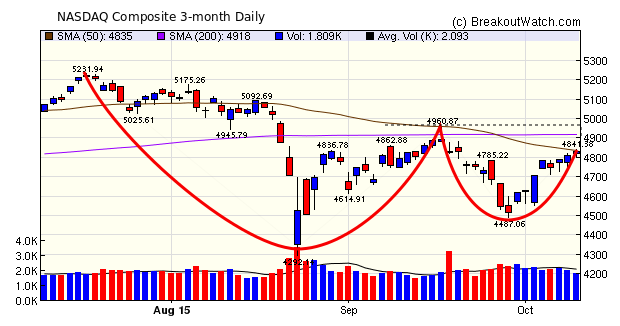
This was a strong week with the NASDAQ Composite gaining 2.6% (Friday to Friday close) although the large cap indexes did even better. The result is that all our trend indicators are now positive. The week also produced the largest number of weekly breakouts (104) since I've been tracking that number (more below).
The NASDAQ itself is showing a double bottom formation with a pivot (and resistance) at 4961. This results in a high number of Double Bottom (70) stocks on the DB watchlist and an even higher number (111) of cup and handle stocks on the CWH list due to the similarity in the pattern shapes. The NASDAQ also faces a psychological hurdle at the 50 day moving average level,just 5 points above Friday's close.
The number of successful breakouts this week rocketed up to 104 from 41 last week. There were 65 Volatility Squeeze breakouts, 15 cup and handle, 6 head and shoulders bottom, 3 Double Bottom and 1 High Tight Flag, which also recorded the highest gain for the week.
| Breakouts for Week Beginning 10/05/15 | |||||||||
| Brkout Date | Symbol | Base | Squeeze | BrkoutOut Price | Brkout Day Close | RS Rank* | Last Close | Current % off BOP | Gain at Intraday High |
|---|---|---|---|---|---|---|---|---|---|
| 10/08/15 | APPEND | HTF | N | 6.27 | 7.00 | 99 | 8.37 | 33.49 | 33.97 |
| 10/07/15 | CORE | CwH | N | 67.21 | 73.30 | 86 | 77.63 | 15.50 | 15.58 |
| 10/05/15 | MEGS | CwH | N | 22.63 | 23.00 | 87 | 25.9 | 14.45 | 15.2 |
| 10/05/15 | MU | HSB | N | 16.36 | 17.57 | 11 | 18.185 | 11.16 | 14.43 |
| 10/06/15 | FONT | CwH | N | 13.81 | 14.49 | 91 | 15.65 | 13.32 | 13.32 |
| 10/05/15 | EVE | CwH | N | 29.57 | 31.75 | 98 | 33.3 | 12.61 | 12.61 |
| 10/07/15 | GEN | CwH | N | 118.45 | 128.20 | 95 | 133.16 | 12.42 | 12.43 |
| 10/05/15 | SPEC | SQZ | Y | 70.33 | 74.39 | 91 | 77.24 | 9.83 | 9.83 |
| 10/05/15 | RD | HSB | N | 18.38 | 18.76 | 31 | 20.04 | 9.03 | 9.41 |
| 10/05/15 | COM | SQZ | Y | 71.25 | 74.93 | 92 | 77.58 | 8.88 | 8.88 |
| 10/07/15 | MARX | CwH | Y | 24.00 | 24.25 | 94 | 25.93 | 8.04 | 8.29 |
| 10/05/15 | YACC | SQZ | Y | 210.00 | 215.58 | 93 | 220.83 | 5.16 | 7.97 |
| 10/07/15 | LYNX | HSB | N | 16.87 | 17.64 | 44 | 18.14 | 7.53 | 7.77 |
| 10/06/15 | SEW | HSB | N | 26.48 | 26.78 | 28 | 28.36 | 7.10 | 7.74 |
| 10/07/15 | FIX | HSB | N | 12.55 | 13.01 | 7 | 13.495 | 7.53 | 7.57 |
| 10/05/15 | MP | SQZ | Y | 51.42 | 53.24 | 80 | 54.98 | 6.92 | 7.55 |
| 10/05/15 | FOCI | SQZ | Y | 83.91 | 85.82 | 86 | 90.18 | 7.47 | 7.5 |
| 10/05/15 | FLT | CwH | N | 52.29 | 54.14 | 96 | 55.89 | 6.88 | 6.88 |
| 10/05/15 | SPAM | CwH | N | 75.83 | 78.45 | 96 | 81 | 6.82 | 6.87 |
| 10/06/15 | NIX | SQZ | Y | 36.39 | 36.89 | 88 | 38.83 | 6.71 | 6.73 |
| 10/05/15 | NETS | SQZ | Y | 122.63 | 129.17 | 88 | 129.1 | 5.28 | 6.59 |
| 10/06/15 | FANG | SQZ | Y | 72.26 | 72.58 | 80 | 76.89 | 6.41 | 6.52 |
| 10/06/15 | TANK | SQZ | Y | 26.48 | 26.78 | 90 | 27.63 | 4.34 | 6.42 |
| 10/05/15 | EX | SQZ | Y | 99.29 | 100.95 | 90 | 105.57 | 6.32 | 6.32 |
| 10/06/15 | VAST | SQZ | Y | 66.66 | 68.63 | 82 | 70.15 | 5.24 | 6.18 |
| 10/06/15 | MS CC | SQZ | Y | 34.00 | 34.35 | 90 | 35.28 | 3.76 | 6.09 |
| 10/05/15 | CB | CwH | Y | 10.28 | 10.90 | 90 | 10.88 | 5.84 | 6.03 |
| 10/07/15 | HAFT | SQZ | Y | 24.72 | 25.24 | 89 | 25.92 | 4.85 | 5.5 |
| 10/07/15 | MS | SQZ | Y | 19.50 | 19.97 | 81 | 20.52 | 5.23 | 5.49 |
| 10/05/15 | OF | HSB | N | 21.17 | 21.73 | 29 | 22.22 | 4.96 | 5.34 |
| 10/07/15 | TANK | SQZ | Y | 26.81 | 27.43 | 93 | 27.63 | 3.06 | 5.11 |
| 10/07/15 | COL | SQZ | Y | 31.37 | 32.35 | 88 | 32.61 | 3.95 | 4.75 |
| 10/07/15 | WK | CwH | Y | 16.34 | 16.63 | 88 | 16.84 | 3.06 | 4.71 |
| 10/08/15 | RHOS | CwH | N | 7.92 | 8.20 | 89 | 8.28 | 4.55 | 4.67 |
| 10/09/15 | HA | SQZ | Y | 26.12 | 27.31 | 95 | 27.31 | 4.56 | 4.56 |
| 10/06/15 | PUFFIN | SQZ | Y | 49.74 | 49.9 | 93 | 51.31 | 3.16 | 4.52 |
| 10/06/15 | HAWK | SQZ | Y | 44.02 | 44.15 | 91 | 45.95 | 4.38 | 4.48 |
| 10/05/15 | BPS | CwH | N | 79.55 | 80.59 | 81 | 82.98 | 4.31 | 4.32 |
| 10/07/15 | PUFFIN | SQZ | Y | 49.85 | 50.94 | 91 | 51.31 | 2.93 | 4.29 |
| 10/05/15 | MS FT | SQZ | Y | 45.50 | 46.63 | 80 | 47.1549 | 3.64 | 4.29 |
| 10/07/15 | ERNST | SQZ | Y | 33.14 | 34.26 | 88 | 34.39 | 3.77 | 4.22 |
| 10/05/15 | FEN | CwH | N | 43.52 | 44.04 | 88 | 45.18 | 3.81 | 4.16 |
| 10/07/15 | BK | SQZ | Y | 35.80 | 36.57 | 88 | 36.6 | 2.23 | 4.16 |
| 10/07/15 | AWL | SQZ | Y | 31.70 | 32.56 | 86 | 32.69 | 3.12 | 3.94 |
| 10/05/15 | SF | CwH | N | 16.80 | 17.07 | 87 | 17.425 | 3.72 | 3.87 |
| 10/06/15 | MP | SQZ | Y | 53.27 | 54.18 | 85 | 54.98 | 3.21 | 3.81 |
| 10/07/15 | NB | SQZ | Y | 26.50 | 27.08 | 84 | 27.27 | 2.91 | 3.74 |
| 10/05/15 | ST | CwH | N | 40.97 | 41.51 | 88 | 42.43 | 3.56 | 3.73 |
| 10/07/15 | HIGHS | SQZ | Y | 34.44 | 35.08 | 88 | 35.71 | 3.69 | 3.72 |
| 10/07/15 | PVT | SQZ | Y | 38.27 | 38.97 | 86 | 39.32 | 2.74 | 3.71 |
| 10/07/15 | ANTI | SQZ | Y | 75.52 | 77.09 | 92 | 78.22 | 3.58 | 3.64 |
| 10/08/15 | ALT | SQZ | Y | 50.71 | 51.72 | 94 | 52.52 | 3.57 | 3.61 |
| 10/07/15 | AGO | SQZ | Y | 26.67 | 27.53 | 86 | 27.365 | 2.61 | 3.6 |
| 10/08/15 | CRAY | DB | N | 54.64 | 55.15 | 82 | 56.505 | 3.41 | 3.44 |
| 10/07/15 | WEBS | SQZ | Y | 36.58 | 37.35 | 83 | 37.6 | 2.79 | 3.28 |
| 10/05/15 | HP | CwH | N | 64.68 | 64.68 | 94 | 66.69 | 3.11 | 3.11 |
| 10/07/15 | HP | CwH | N | 64.68 | 65.68 | 94 | 66.69 | 3.11 | 3.11 |
| 10/07/15 | WAD | SQZ | Y | 23.12 | 23.56 | 82 | 23.7 | 2.51 | 3.07 |
| 10/09/15 | LUV | SQZ | Y | 38.76 | 39.915 | 82 | 39.915 | 2.98 | 3.04 |
| 10/06/15 | MELD | SQZ | Y | 14.18 | 14.37 | 87 | 14.605 | 3.00 | 3.03 |
| 10/07/15 | CHIC | SQZ | Y | 32.21 | 32.55 | 83 | 32.92 | 2.20 | 2.98 |
| 10/08/15 | D | DB | N | 57.21 | 58.19 | 83 | 58.91 | 2.97 | 2.97 |
| 10/07/15 | FPS | SQZ | Y | 19.73 | 20.08 | 86 | 20.08 | 1.77 | 2.89 |
| 10/07/15 | FF | SQZ | Y | 18.82 | 19.15 | 87 | 19.08 | 1.38 | 2.71 |
| 10/07/15 | BARN | CwH | N | 48.23 | 49.35 | 85 | 48.74 | 1.06 | 2.61 |
| 10/07/15 | CATY | SQZ | Y | 30.07 | 30.51 | 84 | 30.41 | 1.13 | 2.36 |
| 10/07/15 | WEB | SQZ | Y | 54.46 | 54.9 | 81 | 55.595 | 2.08 | 2.26 |
| 10/06/15 | SF | SQZ | Y | 17.08 | 17.33 | 87 | 17.425 | 2.02 | 2.17 |
| 10/08/15 | OR | SQZ | Y | 16.18 | 16.53 | 85 | 16.45 | 1.67 | 2.16 |
| 10/06/15 | CANS | SQZ | Y | 21.30 | 21.32 | 85 | 21.74 | 2.07 | 2.11 |
| 10/07/15 | IND | SQZ | Y | 45.36 | 46.11 | 84 | 45.79 | 0.95 | 2.05 |
| 10/07/15 | CANS | SQZ | Y | 21.32 | 21.4 | 90 | 21.74 | 1.97 | 2.02 |
| 10/08/15 | LB | SQZ | Y | 94.68 | 96.53 | 90 | 96.43 | 1.85 | 1.95 |
| 10/07/15 | PREY | SQZ | Y | 49.88 | 50.61 | 87 | 50.74 | 1.72 | 1.94 |
| 10/08/15 | COL | SQZ | Y | 32.28 | 32.86 | 90 | 32.61 | 1.02 | 1.8 |
| 10/08/15 | VENT | SQZ | Y | 18.61 | 18.66 | 82 | 18.94 | 1.77 | 1.77 |
| 10/08/15 | TICS | CwH | N | 19.05 | 19.20 | 83 | 19.38 | 1.73 | 1.76 |
| 10/08/15 | SUBSIST | SQZ | Y | 38.42 | 39.08 | 81 | 38.77 | 0.91 | 1.72 |
| 10/09/15 | PAGE | SQZ | Y | 25.74 | 26.07 | 92 | 26.07 | 1.28 | 1.55 |
| 10/09/15 | ALT | SQZ | Y | 51.75 | 52.52 | 94 | 52.52 | 1.49 | 1.53 |
| 10/08/15 | JET | CwH | N | 38.92 | 39.18 | 91 | 39.5 | 1.49 | 1.52 |
| 10/07/15 | NYC | SQZ | Y | 18.42 | 18.58 | 88 | 18.515 | 0.52 | 1.41 |
| 10/07/15 | SN | SQZ | Y | 29.81 | 30.03 | 85 | 29.9 | 0.30 | 1.21 |
| 10/08/15 | FPS | SQZ | Y | 20.07 | 20.3 | 87 | 20.08 | 0.05 | 1.15 |
| 10/08/15 | WEBS | SQZ | Y | 37.36 | 37.78 | 84 | 37.6 | 0.64 | 1.12 |
| 10/08/15 | FIN | SQZ | Y | 32.21 | 32.57 | 84 | 32.14 | -0.22 | 1.12 |
| 10/09/15 | ML | CwH | N | 12.96 | 13.09 | 97 | 13.09 | 1.00 | 1.05 |
| 10/05/15 | BF | CwH | N | 15.19 | 15.23 | 81 | 15.32 | 0.86 | 0.99 |
| 10/06/15 | SINS | CwH | N | 14.09 | 14.20 | 97 | 14.11 | 0.14 | 0.99 |
| 10/09/15 | DYKE | SQZ | Y | 26.35 | 26.6 | 86 | 26.6 | 0.95 | 0.95 |
| 10/09/15 | AH | CwH | N | 19.25 | 19.42 | 86 | 19.42 | 0.88 | 0.88 |
| 10/07/15 | CT | DB | Y | 19.36 | 19.41 | 83 | 19.49 | 0.67 | 0.88 |
| 10/09/15 | JET | SQZ | Y | 39.21 | 39.5 | 90 | 39.5 | 0.74 | 0.77 |
| 10/08/15 | OZARK | SQZ | Y | 46.17 | 46.5 | 94 | 46.07 | -0.22 | 0.71 |
| 10/09/15 | CHM | CwH | N | 30.45 | 30.63 | 92 | 30.63 | 0.59 | 0.62 |
| 10/09/15 | PECS | CwH | N | 10.24 | 10.28 | 94 | 10.28 | 0.39 | 0.49 |
| 10/06/15 | SQ BK | SQZ | Y | 26.26 | 26.32 | 87 | 27.63 | N/A | 0.23 |
| 10/08/15 | CAKE | SQZ | Y | 54.77 | 54.88 | 84 | 54.6 | -0.31 | 0.2 |
| 10/08/15 | RUSK | CwH | N | 81.28 | 81.41 | 92 | 81.17 | -0.14 | 0.16 |
| 10/06/15 | SOC | SQZ | Y | 13.42 | 13.44 | 98 | 13.27 | -1.12 | 0.15 |
| 10/07/15 | MUM | CwH | Y | 14.12 | 14.13 | 82 | 14.05 | -0.50 | 0.14 |
| 10/05/15 | HEM | SQZ | Y | 75.20 | 75.22 | 89 | 77.58 | N/A | 0.05 |
| 10/08/15 | THOR | CwH | N | 63.49 | 63.50 | 99 | 81.17 | N/A | 0.02 |
| 10/07/15 | HEM | SQZ | Y | 75.24 | 75.24 | 87 | 45.79 | N/A | -0 |
| Weekly Average (104 breakouts) | 3.88 | 4.41 | |||||||
| *RS Rank on day before breakout. | |||||||||
No new features this week.
Prepare for the Many Breakout Alerts Expected Next Week
As of Friday, October 9, there were 207 breakout candidates on our watchlists, distributed as shown in the table below. With the markets now trending up we can expect prices to move higher resulting in a high number of alerts, especially from stocks in a Cup and Handle and Double Bottom pattern.
| Chart Pattern | List Symbol | Potential
Breakouts as of 9/10/15 |
|---|---|---|
| Cup and Handle | CWH | 111 |
| Double Bottom | DB | 70 |
| Head and Shoulders Bottom | HSB | 11 |
| High Tight Flag | HTF | 2 |
| Volatility Squeeze | SQZ | 13 |
| Total | 207 |
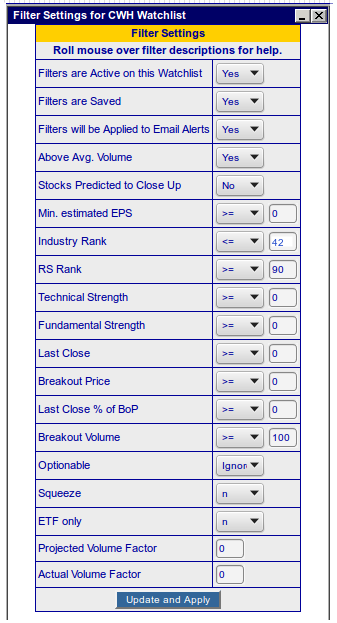
To prevent being inundates with alerts, and to only receive high potential value alerts, I strongly recommend you set filters on at least the cup and handle and double bottom watchlists. Last week I suggested a strategy for trading cup and handle stocks for optimal return and I also suggest the same strategy for double bottom pattern breakouts because of the similarity of the two patterns. (A double bottom is essentially a cup with a low handle).
A set of filters that corresponds to the suggested strategy is:
| Index | Value | Change Week | Change YTD | Trend | ||||||||||||||||||||||||||||||||||||
|---|---|---|---|---|---|---|---|---|---|---|---|---|---|---|---|---|---|---|---|---|---|---|---|---|---|---|---|---|---|---|---|---|---|---|---|---|---|---|---|---|
| Dow | 17084.5 | 3.72% | -4.14% | Up | ||||||||||||||||||||||||||||||||||||
| NASDAQ | 4830.47 | 2.61% | 1.99% | Up | ||||||||||||||||||||||||||||||||||||
| S&P 500 | 2014.89 | 3.26% | -2.14% | Up | ||||||||||||||||||||||||||||||||||||
1The Market Signal is derived
from our proprietary market model. The market model is
described on the site.
2The site also shows industry rankings based on fundamentals, combined technical and fundamentals, and on price alone. The site also shows daily industry movements. |
||||||||||||||||||||||||||||||||||||||||
|
Category
|
Symbol
|
Company Name
|
Expected Gain1
|
|---|---|---|---|
| Best Overall | PVG | Pretium Resources, Inc. | 101 |
| Top Technical | PVG | Pretium Resources, Inc. | 101 |
| Top Fundamental | HTBK | Heritage Commerce Corp | 75 |
| Top Tech. & Fund. | NHTC | Natural Health Trends Corp. | 58 |
|
Category
|
Symbol
|
Company Name
|
Expected Gain1
|
|---|---|---|---|
| Best Overall | MXL | MaxLinear, Inc | 80 |
| Top Technical | HPY | Heartland Payment Systems, Inc. | 35 |
| Top Fundamental | AFH | Atlas Financial Holdings, Inc. | 56 |
| Top Tech. & Fund. | VRSK | Verisk Analytics, Inc. | 0 |
If you received this newsletter from a friend and you would like to receive it regularly please go to the BreakoutWatch.com site and enter as a Guest. You will then be able to register to receive the newsletter.
Copyright © 2015 NBIcharts, LLC dba BreakoutWatch.com. All rights
reserved.
" BreakoutWatch," the BreakoutWatch.com "eye" logo, and the slogan
"tomorrow's breakouts today" are service marks of NBIcharts LLC.
All other marks are the property of their respective owners, and
are used for descriptive purposes only.
BreakoutWatch is not affiliated with Investor's Business Daily or
with Mr. William O'Neil. Our site, research and analysis is
supported entirely by subscription and is free from advertising.