| Market Summary | Weekly Breakout Report | Top Breakout Choices | Top 2nd Chances | New Features | Tip of the Week |
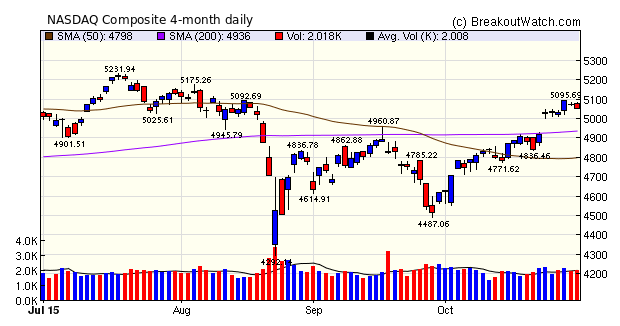
The NASDAQ Composite gained only 0.4% for the week, but it was sufficient to more than double the S&P 500 (0.2%). For the month the NASDAQ gained 9.4%, beating the DJI (8.5%) and the S&P 500 (8.3%).
The gains for the week were strengthened by better than expected earnings by Apple which gained 4% on Wednesday giving the index its only above average volume for the week.
A slowing economy (just 1.5% annualized in the 3rd quarter) and continued expectation of an interest rate increase in December by the Fed, is likely to hold back gains in the near term.
This was another strong week for breakouts with 7 out of 100 gaining more than 10% to their intraday high. These 7 were dominated by breakouts from a Volatility Squeeze and Head and Shoulders Bottom pattern indicating that it is the beaten down stocks that have the most to gain from the current market conditions.
| Breakouts for Week Beginning 10/26/15 | |||||||||
| Brkout Date | Symbol | Base | Squeeze | BrkoutOut Price | Brkout Day Close | RS Rank* | Last Close | Current % off BOP | Gain at Intraday High |
|---|---|---|---|---|---|---|---|---|---|
| 10/29/15 | CYTK | SQZ | Y | 7.62 | 8.86 | 93 | 8.61 | 12.99 | 16.27 |
| 10/28/15 | ABAX | HSB | N | 46.06 | 53.49 | 23 | 50.21 | 9.01 | 16.13 |
| 10/28/15 | NHTC | CwH | N | 42.88 | 44.00 | 99 | 49.26 | 14.88 | 14.88 |
| 10/28/15 | LMAT | SQZ | Y | 12.76 | 13.99 | 97 | 13.32 | 4.39 | 13.32 |
| 10/28/15 | JBSS | SQZ | Y | 57.38 | 60.23 | 96 | 64.72 | 12.79 | 12.79 |
| 10/30/15 | VRTS | HSB | N | 103.84 | 117.04 | 16 | 117.04 | 12.71 | 12.71 |
| 10/28/15 | CAI | HSB | N | 10.68 | 11.90 | 5 | 11.62 | 8.80 | 11.42 |
| 10/28/15 | ASGN | CwH | N | 41.23 | 41.47 | 89 | 45.11 | 9.41 | 9.41 |
| 10/28/15 | STE | DB | Y | 69.49 | 71.04 | 72 | 74.95 | 7.86 | 7.86 |
| 10/29/15 | GWB | CwH | N | 26.57 | 28.54 | 90 | 28.26 | 6.36 | 7.41 |
| 10/29/15 | EIG | CwH | N | 24.89 | 26.73 | 82 | 26.47 | 6.35 | 7.39 |
| 10/27/15 | ELLI | SQZ | Y | 70.59 | 72.5 | 95 | 72.98 | 3.39 | 7.1 |
| 10/26/15 | OSBC | SQZ | Y | 6.54 | 6.55 | 87 | 6.7 | 2.45 | 6.88 |
| 10/29/15 | TGI | HSB | N | 43.62 | 45.61 | 13 | 46.58 | 6.79 | 6.79 |
| 10/28/15 | SXI | DB | N | 84.20 | 84.47 | 75 | 89.72 | 6.56 | 6.56 |
| 10/29/15 | PARR | CwH | N | 21.90 | 23.16 | 89 | 22.8 | 4.11 | 5.75 |
| 10/27/15 | BHLB | DB | N | 28.31 | 28.97 | 77 | 28.6 | 1.02 | 5.55 |
| 10/28/15 | YDKN | CwH | N | 22.90 | 24.10 | 87 | 23.55 | 2.84 | 5.24 |
| 10/28/15 | CBM | SQZ | Y | 44.69 | 47.03 | 98 | 45.97 | 2.86 | 5.24 |
| 10/26/15 | PZZA | SQZ | Y | 70.54 | 72.46 | 89 | 70.17 | -0.52 | 5.2 |
| 10/28/15 | BBSI | CwH | N | 46.75 | 47.86 | 90 | 48.98 | 4.77 | 4.98 |
| 10/28/15 | SBCF | SQZ | Y | 14.95 | 15.62 | 82 | 15.48 | 3.55 | 4.88 |
| 10/26/15 | DCOM | CwH | N | 17.55 | 17.68 | 83 | 17.35 | -1.14 | 4.79 |
| 10/29/15 | SGYP | SQZ | Y | 6.34 | 6.63 | 97 | 6.41 | 1.10 | 4.57 |
| 10/28/15 | ULTI | CwH | N | 195.86 | 202.82 | 90 | 204.35 | 4.33 | 4.48 |
| 10/27/15 | PLCM | CwH | N | 13.44 | 13.46 | 81 | 13.78 | 2.53 | 4.46 |
| 10/29/15 | ERI | SQZ | Y | 9.48 | 9.82 | 98 | 9.9 | 4.43 | 4.43 |
| 10/28/15 | PEGA | CwH | N | 27.00 | 28.17 | 90 | 27.89 | 3.30 | 4.33 |
| 10/28/15 | CIA | CwH | N | 8.48 | 8.84 | 94 | 8.4 | -0.94 | 4.25 |
| 10/28/15 | TSO | SQZ | Y | 104.59 | 105.28 | 94 | 106.93 | 2.24 | 4.21 |
| 10/28/15 | ELLI | SQZ | Y | 72.55 | 73.15 | 97 | 72.98 | 0.59 | 4.2 |
| 10/28/15 | AIG | CwH | N | 61.40 | 63.89 | 81 | 63.06 | 2.70 | 4.06 |
| 10/27/15 | COH | HSB | N | 30.48 | 31.65 | 32 | 31.2 | 2.36 | 3.84 |
| 10/29/15 | MDWD | CwH | N | 9.39 | 9.75 | 96 | 8.98 | -4.37 | 3.83 |
| 10/28/15 | SYBT | CwH | N | 38.49 | 39.93 | 87 | 37.68 | -2.10 | 3.74 |
| 10/28/15 | EDU | CwH | N | 26.75 | 26.87 | 93 | 27.51 | 2.84 | 3.66 |
| 10/28/15 | MRCY | CwH | N | 17.69 | 18.32 | 93 | 17.16 | -3.00 | 3.56 |
| 10/29/15 | TSO | SQZ | Y | 105.33 | 108.99 | 93 | 106.93 | 1.52 | 3.47 |
| 10/28/15 | LXFT | SQZ | Y | 66.73 | 69.04 | 97 | 66.64 | -0.13 | 3.46 |
| 10/30/15 | FIX | CwH | N | 30.89 | 31.93 | 98 | 31.93 | 3.37 | 3.37 |
| 10/29/15 | ELLI | SQZ | Y | 73.23 | 75.6 | 96 | 72.98 | -0.34 | 3.24 |
| 10/28/15 | BHLB | SQZ | Y | 28.99 | 29.88 | 83 | 28.6 | -1.35 | 3.07 |
| 10/28/15 | CHMT | CwH | N | 31.00 | 31.00 | 90 | 31.94 | 3.03 | 3.03 |
| 10/30/15 | CHMT | CwH | N | 31.00 | 31.94 | 92 | 31.94 | 3.03 | 3.03 |
| 10/30/15 | WNC | HSB | Y | 11.62 | 11.97 | 35 | 11.97 | 3.01 | 3.01 |
| 10/29/15 | LMAT | SQZ | Y | 14.04 | 14.46 | 98 | 13.32 | -5.13 | 2.99 |
| 10/28/15 | DCOM | SQZ | Y | 17.86 | 18.39 | 86 | 17.35 | -2.86 | 2.97 |
| 10/28/15 | PVTB | CwH | N | 41.99 | 43.23 | 89 | 41.83 | -0.38 | 2.95 |
| 10/28/15 | XRAY | CwH | N | 59.15 | 59.27 | 90 | 60.85 | 2.87 | 2.87 |
| 10/28/15 | WNC | HSB | N | 11.64 | 11.67 | 36 | 11.97 | 2.84 | 2.84 |
| 10/28/15 | AOS | CwH | N | 74.70 | 76.42 | 91 | 76.82 | 2.84 | 2.84 |
| 10/28/15 | FULT | CwH | N | 13.43 | 13.80 | 86 | 13.42 | -0.07 | 2.76 |
| 10/28/15 | PGC | CwH | N | 22.54 | 23.12 | 83 | 22.61 | 0.31 | 2.66 |
| 10/28/15 | FPRX | HTF | N | 32.48 | 33.34 | 98 | 32.15 | -1.02 | 2.65 |
| 10/28/15 | CUBI | CwH | N | 27.38 | 28.09 | 93 | 27.5 | 0.44 | 2.59 |
| 10/28/15 | SERV | SQZ | Y | 34.76 | 35.39 | 87 | 35.65 | 2.56 | 2.56 |
| 10/28/15 | LYTS | CwH | N | 10.74 | 11.00 | 94 | 10.74 | 0.00 | 2.42 |
| 10/30/15 | CTRP | CwH | N | 90.78 | 92.97 | 97 | 92.97 | 2.41 | 2.41 |
| 10/28/15 | IPGP | HSB | N | 82.02 | 83.89 | 67 | 82.62 | 0.73 | 2.28 |
| 10/28/15 | CFFN | CwH | N | 12.91 | 13.07 | 81 | 12.98 | 0.54 | 2.25 |
| 10/28/15 | BDGE | CwH | N | 29.44 | 30.10 | 86 | 28.71 | -2.48 | 2.24 |
| 10/28/15 | METR | CwH | N | 31.37 | 32.06 | 93 | 30.98 | -1.24 | 2.2 |
| 10/28/15 | CVG | CwH | N | 25.73 | 26.29 | 89 | 25.67 | -0.23 | 2.18 |
| 10/29/15 | CVRR | CwH | N | 21.50 | 21.62 | 85 | 21.96 | 2.14 | 2.14 |
| 10/30/15 | FLS | HSB | N | 45.40 | 46.36 | 26 | 46.36 | 2.11 | 2.11 |
| 10/28/15 | PFSW | CwH | N | 15.69 | 16.00 | 95 | 16.02 | 2.10 | 2.1 |
| 10/30/15 | QUNR | CwH | N | 47.61 | 48.57 | 95 | 48.57 | 2.02 | 2.06 |
| 10/28/15 | FICO | CwH | N | 91.47 | 93.35 | 84 | 92.37 | 0.98 | 2.06 |
| 10/28/15 | CSGS | CwH | N | 32.96 | 33.55 | 90 | 33.52 | 1.70 | 1.85 |
| 10/30/15 | CVI | SQZ | Y | 43.68 | 44.46 | 85 | 44.46 | 1.79 | 1.79 |
| 10/28/15 | ACIW | CwH | N | 23.96 | 24.36 | 86 | 23.95 | -0.04 | 1.67 |
| 10/28/15 | WAFD | CwH | N | 25.11 | 25.52 | 88 | 24.94 | -0.68 | 1.63 |
| 10/29/15 | CHDN | CwH | N | 144.48 | 145.98 | 93 | 146.83 | 1.63 | 1.63 |
| 10/27/15 | XLNX | CwH | N | 48.44 | 49.22 | 90 | 47.62 | -1.69 | 1.61 |
| 10/28/15 | FFIN | CwH | N | 34.15 | 34.67 | 84 | 33.26 | -2.61 | 1.52 |
| 10/28/15 | PF | SQZ | Y | 43.96 | 44.61 | 86 | 44.08 | 0.27 | 1.48 |
| 10/28/15 | GD | CwH | N | 148.80 | 150.78 | 81 | 148.58 | -0.15 | 1.33 |
| 10/30/15 | PMCS | HTF | N | 11.78 | 11.92 | 98 | 11.92 | 1.19 | 1.19 |
| 10/28/15 | WAL | CwH | N | 36.34 | 36.76 | 91 | 35.75 | -1.62 | 1.16 |
| 10/28/15 | HTLF | CwH | N | 37.87 | 38.31 | 91 | 36.84 | -2.72 | 1.16 |
| 10/30/15 | TKR | HSB | N | 31.26 | 31.60 | 27 | 31.6 | 1.09 | 1.09 |
| 10/28/15 | SSD | CwH | N | 37.91 | 38.31 | 85 | 37.98 | 0.18 | 1.06 |
| 10/30/15 | LPG | HSB | N | 11.66 | 11.78 | 26 | 11.78 | 1.03 | 1.03 |
| 10/28/15 | FBNC | CwH | N | 18.97 | 19.13 | 82 | 18.53 | -2.32 | 0.84 |
| 10/29/15 | BKU | SQZ | Y | 37.87 | 38.17 | 90 | 37.18 | -1.82 | 0.79 |
| 10/30/15 | DLR | CwH | N | 73.47 | 73.96 | 83 | 73.96 | 0.67 | 0.67 |
| 10/28/15 | QCRH | CwH | N | 23.89 | 24.05 | 92 | 22.78 | -4.65 | 0.67 |
| 10/29/15 | FCB | CwH | N | 35.58 | 35.82 | 94 | 35.56 | -0.06 | 0.67 |
| 10/28/15 | CBI | HSB | N | 44.58 | 44.86 | 25 | 44.87 | 0.65 | 0.65 |
| 10/28/15 | PSB | CwH | N | 86.05 | 86.37 | 82 | 85.79 | -0.30 | 0.64 |
| 10/28/15 | CEVA | CwH | N | 23.80 | 23.95 | 97 | 23.37 | -1.81 | 0.63 |
| 10/28/15 | BANR | CwH | Y | 50.41 | 50.48 | 84 | 49.07 | -2.66 | 0.61 |
| 10/28/15 | GT | CwH | N | 33.22 | 33.40 | 94 | 32.84 | -1.14 | 0.54 |
| 10/29/15 | BANR | SQZ | Y | 50.49 | 50.72 | 86 | 49.07 | -2.81 | 0.46 |
| 10/30/15 | DATE | SQZ | Y | 6.57 | 6.6 | 89 | 6.6 | 0.46 | 0.46 |
| 10/30/15 | TCBK | CwH | N | 26.25 | 26.36 | 80 | 26.36 | 0.42 | 0.42 |
| 10/30/15 | ERI | SQZ | Y | 9.86 | 9.9 | 99 | 9.9 | 0.41 | 0.41 |
| 10/30/15 | TSC | SQZ | Y | 12.46 | 12.49 | 82 | 12.49 | 0.24 | 0.24 |
| 10/28/15 | DW | CwH | N | 61.86 | 61.90 | 87 | 59.83 | -3.28 | 0.06 |
| 10/29/15 | AFAM | SQZ | Y | 41.48 | 41.5 | 85 | 41.38 | -0.24 | 0.05 |
| Weekly Average (100 breakouts) | 1.63 | 3.69 | |||||||
| *RS Rank on day before breakout. | |||||||||
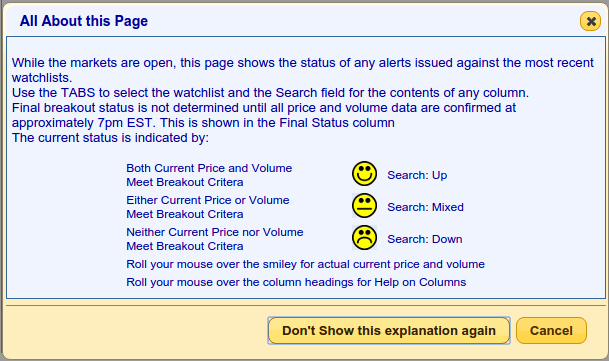
I have continued work on making the site more responsive so that it plays better on mobile devices. This week's innovation is to the "Alerts Issued Today" page. This page now consolidates now includes informatin about the current state of each alert, which was previously only available on the "Alert Monitor". because of this consolidation, I have now dropped the alert monitor page.
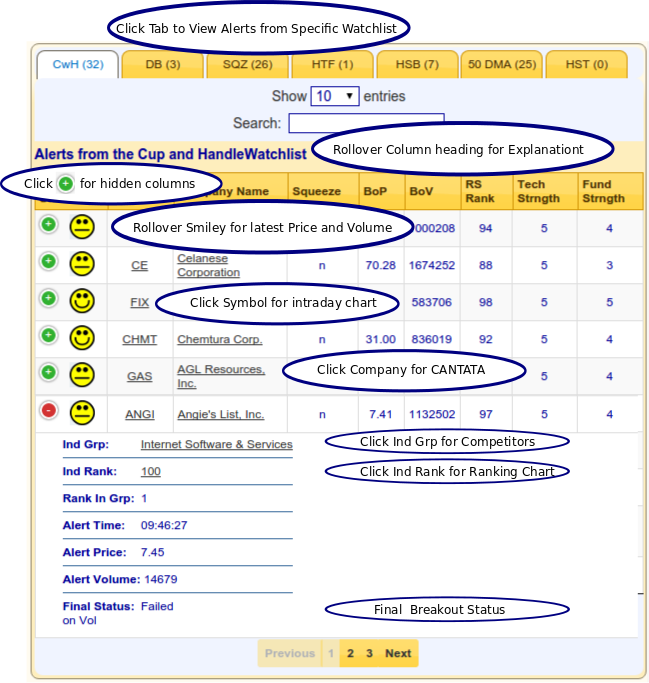
Use of the page is described below.
New Breakout Alert Monitoring Features
The first time you open the new Alerts page, you will see this popup window (assuming you allow pop-ups). I suggest you read it and then click the "Don't show this explanation again" so you won't be bothered by the popup again.
If you are viewing the page on a phone with a 600 pixel wide view port, will see something like this. The Balloons explain how to use each feature.
| Index | Value | Change Week | Change YTD | Trend | ||||||||||||||||||||||||||||||||||||
|---|---|---|---|---|---|---|---|---|---|---|---|---|---|---|---|---|---|---|---|---|---|---|---|---|---|---|---|---|---|---|---|---|---|---|---|---|---|---|---|---|
| Dow | 17663.5 | 0.1% | -0.9% | Up | ||||||||||||||||||||||||||||||||||||
| NASDAQ | 5053.75 | 0.44% | 6.71% | Up | ||||||||||||||||||||||||||||||||||||
| S&P 500 | 2079.36 | 0.2% | 0.99% | Up | ||||||||||||||||||||||||||||||||||||
1The Market Signal is derived
from our proprietary market model. The market model is
described on the site.
2The site also shows industry rankings based on fundamentals, combined technical and fundamentals, and on price alone. The site also shows daily industry movements. |
||||||||||||||||||||||||||||||||||||||||
|
Category
|
Symbol
|
Company Name
|
Expected Gain1
|
|---|---|---|---|
| Best Overall | PLNR | Planar Systems, Inc. | 100 |
| Top Technical | PLNR | Planar Systems, Inc. | 100 |
| Top Fundamental | PAYC | Paycom Software, Inc. | 58 |
| Top Tech. & Fund. | VIMC | Vimicro International Corporation | 57 |
|
Category
|
Symbol
|
Company Name
|
Expected Gain1
|
|---|---|---|---|
| Best Overall | CIA | Citizens, Inc. | 89 |
| Top Technical | MDWD | MediWound Ltd. | 74 |
| Top Fundamental | FIX | Comfort Systems USA, Inc. | 49 |
| Top Tech. & Fund. | FIX | Comfort Systems USA, Inc. | 49 |
If you received this newsletter from a friend and you would like to receive it regularly please go to the BreakoutWatch.com site and enter as a Guest. You will then be able to register to receive the newsletter.
Copyright © 2015 NBIcharts, LLC dba BreakoutWatch.com. All rights
reserved.
" BreakoutWatch," the BreakoutWatch.com "eye" logo, and the slogan
"tomorrow's breakouts today" are service marks of NBIcharts LLC.
All other marks are the property of their respective owners, and
are used for descriptive purposes only.
BreakoutWatch is not affiliated with Investor's Business Daily or
with Mr. William O'Neil. Our site, research and analysis is
supported entirely by subscription and is free from advertising.