Breakoutwatch Weekly Newsletter 02/26/16

You are receiving this email because you are or were a BreakoutWatch.com subscriber, or have subscribed to our weekly newsletter. This newsletter summarizes the breakout events of the week and provides additional guidance that does not fit into our daily format. It is published each weekend.

Weekly Commentary

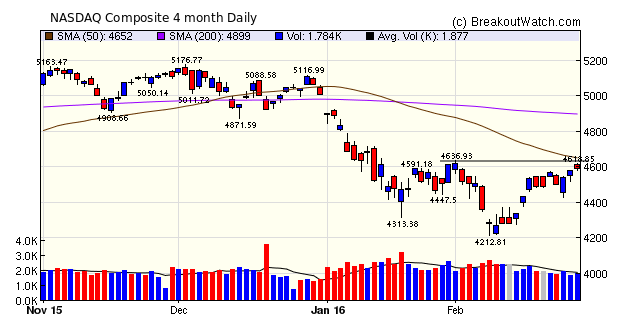
The NASDAQ Composite out paced the S&P 500 and DJI to close 2.3% higher for the week, but this was not sufficient to turn around our trend indicator for the NASDAQ which continues to point down. In contrast, the trend indicator for the the other two major indexes turned up this week and I expect the NASDAQ trend will reverse if Monday delivers a positive trading day.

Counter to this, however, was the weakness in the large cap stocks on Friday, as traders fear that the upward revisions to Q4 GDP will  bring on sooner than expected interest rate increases by the Fed.

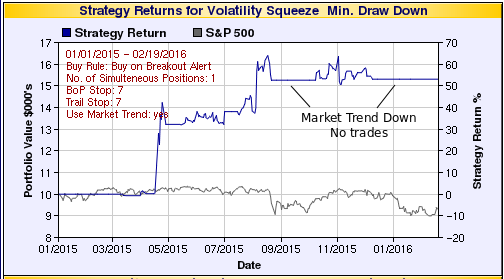
As most breakouts come from the NASDAQ market, I continue to suggest caution is appropriate until the NASDAQ  trend indicator turns up.

NASDAQ Chart

Weekly Breakout Report

The number of  breakouts increased this week and gave a strong average  return of 4.6%.
Breakouts Summary by Watchlist for Week Beginning 02/22/16
List Breakouts Avg. Gain
CwH 12 3.25
SQZ 17 3.73
HTF 1 4.65
HSB 4 10.5
DB 1 11.47
Breakouts Detail for Week Beginning 02/22/16
Brkout Date Symbol Base Squeeze BrkoutOut Price Brkout Day Close RS Rank* Last Close Current % off BOP Gain at Intraday High
02/26/16 SPXC HSB N 9.49 11.18 19 11.175 17.76 18.12
02/25/16 TRGP HSB N 22.48 24.26 4 25.58 13.79 13.97
02/22/16 LFVN SQZ Y 8.74 8.85 98 9.79 12.01 12.13
02/23/16 MSI DB N 67.20 70.73 77 74.91 11.47 11.49
02/23/16 LFVN SQZ Y 8.86 9.08 98 9.79 10.50 10.61
02/22/16 MOV CwH N 26.93 27.38 91 29.31 8.84 8.84
02/23/16 ORBK SQZ Y 20.96 22 94 22.64 8.02 8.06
02/23/16 EXLS SQZ Y 45.17 48.444 95 47.42 4.98 7.77
02/22/16 NPK SQZ Y 81.76 83.22 87 80.83 -1.14 7
02/24/16 IPHS HSB N 26.46 28.06 17 28.21 6.61 6.92
02/22/16 SNC SQZ Y 10.51 11.16 90 11.21 6.66 6.85
02/24/16 SBGL HTF N 12.90 12.97 99 13.5 4.65 6.59
02/25/16 TGS SQZ Y 6.41 6.62 98 6.74 5.15 5.62
02/25/16 GDOT CwH N 19.90 20.69 95 20.865 4.85 4.95
02/26/16 CCOI CwH N 35.31 36.95 89 36.95 4.64 4.64
02/25/16 RGR CwH N 66.86 69.11 96 69.94 4.61 4.61
02/24/16 DORM CwH N 49.29 50.00 82 50.72 2.90 4.34
02/22/16 GGAL CwH N 28.62 28.98 97 29.84 4.26 4.26
02/25/16 KEP CwH N 22.87 23.62 86 23.835 4.22 4.24
02/26/16 PPBI SQZ Y 20.69 21.56 80 21.56 4.20 4.2
02/22/16 HTHT SQZ Y 27.32 28.43 89 28.02 2.56 4.14
02/25/16 ENB HSB N 33.51 33.64 29 34.8 3.85 3.88
02/22/16 ZAGG SQZ Y 10.03 10.35 96 10.34 3.09 3.69
02/24/16 CVG CwH N 25.22 26.10 81 25.73 2.02 3.65
02/26/16 GVA SQZ Y 39.42 40.81 86 40.81 3.53 3.55
02/24/16 AAAP CwH N 32.00 32.49 97 32.98 3.06 3.13
02/23/16 WFD SQZ Y 8.21 8.22 89 8.32 1.34 2.31
02/25/16 BGFV CwH N 13.30 13.57 95 13.29 -0.08 2.18
02/25/16 MKL SQZ Y 867.00 882.72 83 866.94 -0.01 1.81
02/26/16 SNDK SQZ Y 71.39 72.05 88 72.05 0.92 1.02
02/25/16 FXCB SQZ Y 18.96 19 92 19.15 1.00 1
02/25/16 RSE CwH Y 18.28 18.31 89 18.19 -0.49 0.6
02/25/16 FMNB SQZ Y 8.41 8.45 81 8.45 0.48 0.48
02/26/16 MR CwH N 27.79 27.85 83 27.85 0.22 0.25
02/26/16 PMF SQZ Y 15.56 15.57 87 15.57 0.06 0.06
Weekly Average (35 breakouts) 4.59 5.34
*RS Rank on day before breakout.
New Features This Week

No new features this week.
Top Tip of the Week

New Volatility Squeeze Trading Suggestions


I have adapted our backtest tool to run on our Volatility Squeeze watchlist historical data. The tool is  accessible from the Evaluate > Analytical  Tools menu.

Based on multiple simulations that I've made with this tool, I have found that the  best returns would have been achieved (since January 2015) by trading  stocks  with these characteristics:
  1. RS Rank of at least 90
  2. NASDAQ market trend must be positive
  3. Within the top 50% of our industry rankings
  4. Buy as soon as we issue an alert
  5. Sell at next open if breakout day volume not at  least 1.75 times 50 day average volume
  6. Set a  trailing stop of 7% based on the highest daily close since breakout.

Using these parameters, our backtest tool gave a return of 53% since  Jan 1, 2015.


SQZ returns

To select suitable candidates from the Volatility Squeeze watchlist, and receive email alerts when they breakout, I suggest the  following filter settings:

SQZ filters
Major Index Summary
Index Value Change Week Change YTD Trend1
Dow 16640
1.38% -4.51% Up
NASDAQ 4590.47
2.29% -8.33% Down
S&P 500 1948.05
1.58% -4.69% Up
1The Market Trend is derived from our proprietary market model. The market model is described on the site.
2The site also shows industry rankings based on fundamentals, combined technical and fundamentals, and on price alone. The site also shows daily industry movements.
Best Performing Index
1 Week 13 Weeks 26 Weeks Year-to-Date
NASDAQ Composite
2.29 %
Dow Jones
-6.51 %
Dow Jones
-0.02 %
Dow Jones
-4.51 %
Best Performing Industry (by average technical score over each period)
1 Week 3 Weeks 13 Weeks 26 Weeks
Cigarettes Music & Video Stores Auto Parts Stores Auto Parts Stores
Most Improved Industry (by change in technical rank2)
Foreign Utilities
+ 64
General Entertainment
+ 98
Silver
+ 183
Silver
+ 185
Charts of each industry rank and performance over 12 months are available on the site
Top Breakout Choices: Stocks on our Cup-and-Handle list with best expected gain if they breakout
Category
Symbol
Company Name
Expected Gain1
Best Overall LSCC
Lattice Semiconductor Corporation
113
Top Technical LSCC
Lattice Semiconductor Corporation
113
Top Fundamental SIMO
Silicon Motion Technology Corporation
41
Top Tech. & Fund. SIMO
Silicon Motion Technology Corporation
41
1This is the gain predicted by our Expected Gain model within 6 months of breakout which uses the volume on breakout as a predictive term. Because the model variance is +/- 38% the expectation can be negative.
Top Second Chances: Stocks that broke out this week and are still in buyable range
Category
Symbol
Company Name
Expected Gain1
Best Overall BGFV
Big 5 Sporting Goods Corporation
60
Top Technical GGAL
Grupo Financiero Galicia S.A.
46
Top Fundamental KEP
Korea Electric Power Corporation
34
Top Tech. & Fund. RGR
Sturm, Ruger & Company, Inc.
40
1This is the gain predicted by our Expected Gain model within 6 months of breakout which uses the volume on breakout as a predictive term. Because the model variance is +/- 38% the expectation can be negative.

If you received this newsletter from a friend and you would like to receive it regularly please go to the BreakoutWatch.com site and enter as a Guest. You will then be able to register to receive the newsletter.

Copyright (c) 02/26/2016 NBIcharts, LLC dba BreakoutWatch.com. All rights reserved.
" BreakoutWatch," the BreakoutWatch.com "eye" logo, and the slogan "tomorrow's breakouts today" are service marks of NBIcharts LLC. All other marks are the property of their respective owners, and are used for descriptive purposes only.

BreakoutWatch is not affiliated with Investor's Business Daily or with Mr. William O'Neil. Our site, research and analysis is supported entirely by subscription and is free from advertising.