Breakoutwatch Weekly Summary 09/03/16
You are receiving this email because you are or were a BreakoutWatch.com subscriber, or have subscribed to our weekly newsletter. This newsletter summarizes the breakout events of the week and provides additional guidance that does not fit into our daily format. It is published each weekend.
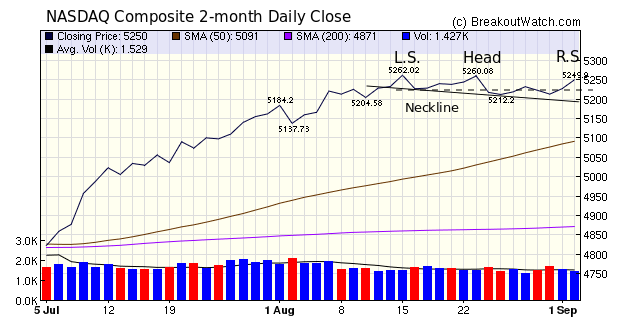
| DJI Trend Indicator Gives Downturn
Warning Our trend indicator for the DJI turned down on Thursday. A weakness in any major indicator can be a warning sign that others may follow, although for now, the trend indicator for both the S&P 500 and NASDAQ Composite remain at 'up'. We know that most breakouts come from the NASDAQ so we follow that index more closely than the others. The NASDAQ chart is showing that a potential head and shoulders top pattern (HST) is forming, with a possible right shoulder being established in Friday's trading. This is not yet a sign for alarm, as the head and shoulders pattern would need to be completed before a distinctive bearish pattern is confirmed. This would occur if the price crosses the dashed line shown in the chart below. That is, a fall to a closing price below 5225. This is worth watching in the coming days. If the HST pattern is completed, then opening new long positions should be discouraged. |
| No new features this week. |
|
Should any of your
holdings complete a head and shoulders top pattern, our
strategy suggestions are:
We published an analysis of Head and Shoulders Top
breakdowns in our newsletter
of 7/29/06. We found that a breakdown occurred in
96.38% of cases. This indicates that the head and shoulders
pattern is a very powerful predictor of a price decline to
come. This is true whether the slope of the neckline is
upwards, flat or downwards. Of these, the decline after
breakdown exceeded 5% in 74.5% of breakdowns.
Upward sloping necklines are much more common than
downward sloping necklines and have a slightly higher
potential return by about 1%.
As with the 50 DMA breakdown watchlist, our suggestions
are based on my analysis of the results quoted, a review of
the literature and the experiences of a short sale hedge
fund manager
Because of the high probability that a breakdown is about to occur, you may wish to open a short position immediately an H&S is identified before waiting for the breakdown. The position can then be added to when the breakdown occurs.Immediately after the breakdown, set a stop loss at the breakdown price to protect yourself against the 17.6% of breakdowns that recover the next day. Otherwise, a reasonable target profit for the trade is 70% of the target price. |
| List | Breakouts | Avg. Gain |
|---|---|---|
| CWH | 11 | 3.26 |
| SQZ | 5 | 2.9 |
| HTF | 0 | |
| HSB | 0 | |
| DB | 0 |
| Brkout Date | Symbol | Base | Squeeze | BrkoutOut Price | Brkout Day Close | RS Rank* | Last Close | Current % off BOP | Gain at Intraday High |
|---|---|---|---|---|---|---|---|---|---|
| 2016-08-30 | AMID | CWH | n | 12.50 | 13 | 92 | 14.28 | 14.24% | 14.4% |
| 2016-08-30 | CLCD | SQZ | y | 9.44 | 11 | 96 | 10.66 | 12.92% | 16.53% |
| 2016-09-02 | AVHI | CWH | n | 15.33 | 16 | 81 | 16.08 | 4.89% | 5.28% |
| 2016-08-29 | LGIH | CWH | n | 36.44 | 38 | 92 | 38.22 | 4.88% | 7.66% |
| 2016-08-30 | USAC | CWH | n | 16.25 | 16 | 85 | 16.86 | 3.75% | 3.75% |
| 2016-08-29 | EVA | CWH | n | 24.64 | 25 | 93 | 25.28 | 2.6% | 3.94% |
| 2016-09-01 | STS | SQZ | y | 17.23 | 17 | 98 | 17.62 | 2.26% | 3.42% |
| 2016-09-02 | SQM | CWH | n | 27.23 | 28 | 95 | 27.74 | 1.87% | 1.87% |
| 2016-09-02 | CIB | CWH | n | 40.16 | 41 | 87 | 40.9 | 1.84% | 2.56% |
| 2016-09-02 | HNRG | CWH | n | 6.75 | 7 | 80 | 6.87 | 1.78% | 4% |
| 2016-08-30 | LMAT | SQZ | y | 18.05 | 18 | 83 | 18.35 | 1.66% | 4.43% |
| 2016-08-30 | INTL | CWH | n | 36.41 | 37 | 85 | 36.84 | 1.18% | 2.33% |
| 2016-09-02 | WK | CWH | n | 17.93 | 18 | 84 | 18.1 | 0.95% | 0.95% |
| 2016-08-31 | CRAI | SQZ | y | 26.85 | 27 | 80 | 26.73 | -0.45% | 16.61% |
| 2016-08-30 | HBP | SQZ | y | 6.36 | 6 | 97 | 6.24 | -1.89% | 5.19% |
| 2016-08-29 | AGM | CWH | n | 40.74 | 41 | 87 | 39.88 | -2.11% | 1.64% |
| *RS Rank on day before breakout. | |||||||||
 |
| Symbol | BO Price |
BO Vol. |
Company | Industry | RS Rank |
Last Close |
|---|---|---|---|---|---|---|
| SKY | 12.29 | 45,186 | Skyline Corporation | Manufactured Housing | 99 | 11.99 |
| SMMF | 20.47 | 49,941 | Summit Financial Group - Inc. | Regional - Mid-Atlantic Banks | 94 | 19.78 |
| ENBL | 14.93 | 364,054 | Enable Midstream Partners - LP | Oil & Gas Pipelines | 93 | 14.25 |
| SMLP | 25.02 | 214,120 | Summit Midstream Partners - LP | Oil & Gas Pipelines | 93 | 24.91 |
| DAKT | 9.99 | 620,024 | Daktronics - Inc. | Computer Based Systems | 92 | 9.74 |
| CEQP | 22.14 | 388,228 | Crestwood Equity Partners LP | Oil & Gas Pipelines | 92 | 20.95 |
| OFG | 11.25 | 564,990 | OFG Bancorp | Money Center Banks | 92 | 10.90 |
| ARLP | 21.20 | 505,524 | Alliance Resource Partners - L.P. | Industrial Metals & Minerals | 92 | 20.77 |
| These stocks meet our suggested screening factors
for our Cup and Handle Chart Pattern watchlist. See Revised Rules for Trading Cup and Handle Breakouts |
||||||
| Index | Value | Change Week | Change YTD | Trend1 |
|---|---|---|---|---|
| Dow | 18492 |
0.53% | 6.12% | Down |
| NASDAQ | 5249.9 |
0.59% | 4.84% | Up |
| S&P 500 | 2179.98 |
0.5% | 6.66% | Up |
|
1The Market Trend is derived from
our proprietary market model. The market model is described on
the sitehere.
2The site also shows industry rankings based on fundamentals, combined technical and fundamentals, and on price alone. The site also shows daily industry movements. |
||||
| 1 Week | 13 Weeks | 26 Weeks | Year-to-Date |
|---|---|---|---|
| NASDAQ Composite |
NASDAQ Composite 6.22 % |
NASDAQ Composite 11.3 % |
S&P 500 6.66 % |
| 1 Week | 3 Weeks | 13 Weeks | 26 Weeks |
|---|---|---|---|
| Manufactured Housing |
Manufactured Housing |
Silver |
Silver |
| Telecom Services - Foreign 65 |
Railroads 79 |
Manufactured Housing 215 |
Manufactured Housing 216 |
| Charts of each industry rank and performance over 12 months are available on the site | |||
If you received this newsletter from a friend and you would like to receive it regularly please go to the BreakoutWatch.com site and you will then be able to register to receive the newsletter.
Copyright (c) 09/03/2016 NBIcharts, LLC dba BreakoutWatch.com. All
rights reserved.
" BreakoutWatch," the BreakoutWatch.com "eye" logo, and the slogan
"tomorrow's breakouts today" are service marks of NBIcharts LLC. All
other marks are the property of their respective owners, and are used
for descriptive purposes only.
BreakoutWatch is not affiliated with Investor's Business Daily or with Mr. William O'Neil. Our site, research and analysis is supported entirely by subscription and is free from advertising.