Breakoutwatch Weekly Summary 09/10/16
You are receiving this email because you are or were a BreakoutWatch.com subscriber, or have subscribed to our weekly newsletter. This newsletter summarizes the breakout events of the week and provides additional guidance that does not fit into our daily format. It is published each weekend.
Immediate Interest Rate Rise Unlikely though Markets Tumble Our trend indicators for large cap stocks are now both negative while the NASDAQ Composite trend remains positive, at least for for now. The index closed below its 50 day average on Friday, and if the sell-off continues into Monday, then I expect the trend indicator for the NASDAQ will also soon turn down. Friday's debacle was ignited by Boston Fed President Eric Rosengren, who said that "a reasonable case can be made for continuing to pursue a gradual normalization of monetary policy". Meaning that an interest rate rise was desirable to extend the recovery of the economy. Cheap money has fueled the rise in the stock market for 8 years now, and markets fear an interest rate rise will bring an end to the bull market. It's unlikely that we will see a rise in September due to the proximity to the November election. 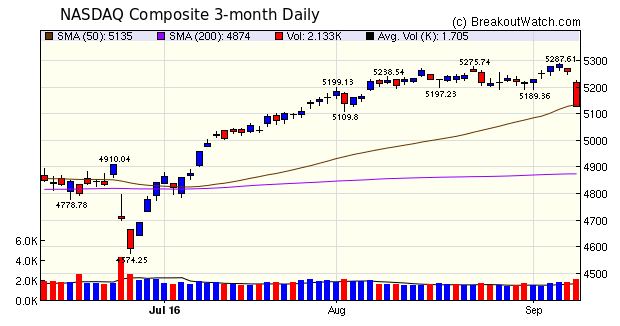 |
| No new features this week. |
|
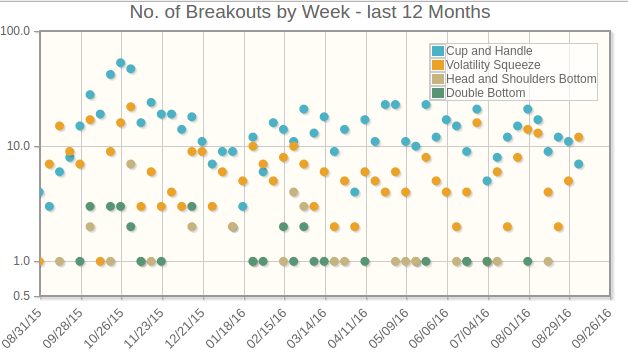
Breakouts this
week mostly showed a negative return by Friday's close so
caution is suggested at this time. While some breakouts will
return positive results, they will be harder to pick.
Only those showing strong volume (greater than 2 times
average) when reaching their breakout price should be
considered.
|
| List | Breakouts | Avg. Gain |
|---|---|---|
| CWH | 7 | -0.41 |
| SQZ | 12 | -0.61 |
| HTF | 2 | 1.52 |
| HSB | 0 | |
| DB | 0 |
| Brkout Date | Symbol | Base | Squeeze | BrkoutOut Price | Brkout Day Close | RS Rank* | Last Close | Current % off BOP | Gain at Intraday High |
|---|---|---|---|---|---|---|---|---|---|
| 2016-09-08 | BGFV | SQZ | y | 13.51 | 14 | 93 | 14.1 | 4.37% | 4.44% |
| 2016-09-06 | CWEI | HTF | n | 69.13 | 70 | 99 | 71.71 | 3.73% | 6.16% |
| 2016-09-09 | SWFT | CWH | y | 19.93 | 21 | 81 | 20.63 | 3.51% | 5.72% |
| 2016-09-06 | ROVI | CWH | n | 21.86 | 22 | 95 | 22.42 | 2.56% | 2.93% |
| 2016-09-07 | GMLP | SQZ | y | 19.69 | 20 | 85 | 20.04 | 1.78% | 4.62% |
| 2016-09-07 | MBTF | SQZ | y | 9.01 | 9 | 87 | 9.11 | 1.11% | 5.11% |
| 2016-09-07 | TEDU | CWH | n | 13.99 | 14 | 92 | 14.07 | 0.57% | 4.72% |
| 2016-09-08 | IOC | SQZ | y | 49.24 | 49 | 90 | 49.36 | 0.24% | 0.93% |
| 2016-09-08 | S | SQZ | y | 6.64 | 7 | 97 | 6.65 | 0.15% | 5.87% |
| 2016-09-09 | JPEP | SQZ | y | 7.92 | 8 | 88 | 7.93 | 0.13% | 1.96% |
| 2016-09-08 | MBTF | SQZ | y | 9.11 | 9 | 86 | 9.11 | 0% | 3.95% |
| 2016-09-08 | ENLC | CWH | n | 17.31 | 18 | 90 | 17.2 | -0.64% | 3% |
| 2016-09-06 | GOL | HTF | n | 21.88 | 22 | 99 | 21.73 | -0.69% | 10.24% |
| 2016-09-08 | VSAR | CWH | y | 13.80 | 14 | 91 | 13.64 | -1.16% | 6.45% |
| 2016-09-06 | PHK | SQZ | y | 10.05 | 10 | 80 | 9.88 | -1.69% | 0.7% |
| 2016-09-07 | QTS | SQZ | y | 55.21 | 56 | 80 | 54.1 | -2.01% | 2.05% |
| 2016-09-08 | KYN | SQZ | y | 20.36 | 21 | 84 | 19.95 | -2.01% | 3.88% |
| 2016-09-08 | STRL | CWH | n | 6.86 | 7 | 83 | 6.69 | -2.48% | 3.06% |
| 2016-09-07 | OMCL | SQZ | y | 39.41 | 40 | 84 | 38.1 | -3.32% | 2.77% |
| 2016-09-07 | ERII | CWH | y | 13.30 | 14 | 99 | 12.6 | -5.26% | 7.44% |
| 2016-09-07 | WOR | SQZ | y | 43.98 | 44 | 92 | 41.32 | -6.05% | 1.16% |
| *RS Rank on day before breakout. | |||||||||
 |
| Symbol | BO Price |
BO Vol. |
Company | Industry | RS Rank |
Last Close |
|---|---|---|---|---|---|---|
| SKY | 12.29 | 47,386 | Skyline Corporation | Manufactured Housing | 99 | 11.66 |
| ENBL | 16.03 | 367,695 | Enable Midstream Partners - LP | Oil & Gas Pipelines | 96 | 15.50 |
| TTMI | 11.09 | 1,578,322 | TTM Technologies - Inc. | Printed Circuit Boards | 95 | 10.40 |
| CRESY | 18.00 | 215,768 | Cresud S.A.C.I.F. y A. | Farm Products | 94 | 17.17 |
| CSAL | 32.14 | 1,675,000 | Communications Sales & Leasing,Inc. | REIT - Industrial | 94 | 30.30 |
| CEQP | 22.14 | 369,771 | Crestwood Equity Partners LP | Oil & Gas Pipelines | 94 | 21.04 |
| BELFB | 23.55 | 55,143 | Bel Fuse Inc. | Diversified Electronics | 93 | 23.39 |
| OFG | 11.25 | 525,762 | OFG Bancorp | Money Center Banks | 93 | 10.57 |
| These stocks meet our suggested screening factors
for our Cup and Handle Chart Pattern watchlist. See Revised Rules for Trading Cup and Handle Breakouts |
||||||
| Index | Value | Change Week | Change YTD | Trend1 |
|---|---|---|---|---|
| Dow | 18085.4 |
-2.2% | 3.79% | Down |
| NASDAQ | 5125.91 |
-2.36% | 2.37% | Up |
| S&P 500 | 2127.81 |
-2.39% | 4.1% | Down |
|
1The Market Trend is derived from
our proprietary market model. The market model is described on
the sitehere.
2The site also shows industry rankings based on fundamentals, combined technical and fundamentals, and on price alone. The site also shows daily industry movements. |
||||
| 1 Week | 13 Weeks | 26 Weeks | Year-to-Date |
|---|---|---|---|
| Dow Jones |
NASDAQ Composite 4.73 % |
NASDAQ Composite 7.95 % |
S&P 500 4.1 % |
| 1 Week | 3 Weeks | 13 Weeks | 26 Weeks |
|---|---|---|---|
| Manufactured Housing |
Manufactured Housing |
Silver |
Silver |
| Computers Wholesale 109 |
Processing Systems & Products 131 |
Manufactured Housing 213 |
Manufactured Housing 216 |
| Charts of each industry rank and performance over 12 months are available on the site | |||
If you received this newsletter from a friend and you would like to receive it regularly please go to the BreakoutWatch.com site and you will then be able to register to receive the newsletter.
Copyright (c) 09/10/2016 NBIcharts, LLC dba BreakoutWatch.com. All
rights reserved.
" BreakoutWatch," the BreakoutWatch.com "eye" logo, and the slogan
"tomorrow's breakouts today" are service marks of NBIcharts LLC. All
other marks are the property of their respective owners, and are used
for descriptive purposes only.
BreakoutWatch is not affiliated with Investor's Business Daily or with Mr. William O'Neil. Our site, research and analysis is supported entirely by subscription and is free from advertising.