Breakoutwatch Weekly Summary 11/12/16
You are receiving this email because you are or were a BreakoutWatch.com subscriber, or have subscribed to our weekly newsletter. This newsletter summarizes the breakout events of the week and provides additional guidance that does not fit into our daily format. It is published each weekend.
| A Surprising Week Delivers an
Average 8.7% in Breakout Gains Our trend signal for the DJI turned positive on Wednesday as the index gained 1.4% on twice the average daily volume following the surprise election win by Trump. While the indicator for the NASDAQ and S&P 500 has not yet turned positive, that will likely occur if the rally continues. The NASDAQ and S&P 500 each gained 3.8% gained while the DJI outperformed with a gain of 5.4%. The week began with a two day rally as expectations mounted that Clinton would win the election but the Trump surprise lifted markets again as he promised infrastructure spending and the repeal and replace of Obama care which produced a very strong breakout of 39% by Health Insurance Innovations (HIIQ) (see below). The expectation that Republican control of the Congress and Executive will deliver aggressive infrastructure spending also raised inflation expectations and with it the near certainty that the Fed will raise interest rates next month. 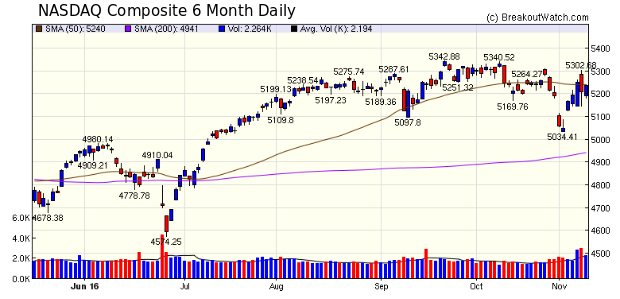 |
| No new features
this week |
| List | Breakouts | Avg. Gain |
|---|---|---|
| CWH | 24 | 8.81 |
| SQZ | 21 | 8.55 |
| HTF | 1 | 13.99 |
| HSB | 0 | |
| DB | 1 | 2.46 |
| Brkout Date | Symbol | Base | Squeeze | BrkoutOut Price | Brkout Day Close | RS Rank* | Last Close | Current % off BOP | Gain at Intraday High |
|---|---|---|---|---|---|---|---|---|---|
| 2016-11-10 | HIIQ | CWH | n | 6.75 | 8 | 87 | 9.2 | 36.3% | 39.26% |
| 2016-11-09 | CENX | SQZ | y | 7.42 | 8 | 88 | 9.56 | 28.84% | 29.11% |
| 2016-11-09 | CECO | CWH | y | 7.40 | 9 | 96 | 9.28 | 25.41% | 26.35% |
| 2016-11-07 | HSC | SQZ | y | 10.06 | 11 | 83 | 12.25 | 21.77% | 24.25% |
| 2016-11-08 | AQMS | SQZ | y | 9.90 | 10 | 96 | 11.8 | 19.19% | 24.65% |
| 2016-11-10 | TPC | SQZ | y | 22.46 | 25 | 86 | 26.25 | 16.87% | 19.01% |
| 2016-11-09 | KEYW | SQZ | y | 10.70 | 12 | 95 | 12.47 | 16.54% | 16.73% |
| 2016-11-07 | BOOT | CWH | n | 13.20 | 14 | 88 | 15.25 | 15.53% | 17.58% |
| 2016-11-09 | OSK | CWH | n | 57.00 | 61 | 89 | 65.71 | 15.28% | 15.35% |
| 2016-11-09 | KMT | CWH | n | 29.99 | 32 | 84 | 34.22 | 14.1% | 14.24% |
| 2016-11-10 | EVI | HTF | n | 9.65 | 10 | 99 | 11 | 13.99% | 13.99% |
| 2016-11-09 | KE | SQZ | y | 14.81 | 15 | 89 | 16.75 | 13.1% | 13.1% |
| 2016-11-09 | SIVB | CWH | n | 128.50 | 132 | 85 | 145.03 | 12.86% | 13.12% |
| 2016-11-09 | SBSI | CWH | n | 33.24 | 34 | 80 | 37.46 | 12.7% | 12.7% |
| 2016-11-09 | MTZ | CWH | n | 30.90 | 32 | 94 | 34.75 | 12.46% | 13.11% |
| 2016-11-10 | OFG | CWH | n | 11.30 | 11 | 90 | 12.55 | 11.06% | 12.39% |
| 2016-11-07 | RLH | CWH | n | 8.55 | 9 | 81 | 9.4 | 9.94% | 9.94% |
| 2016-11-09 | FPRX | SQZ | y | 50.37 | 54 | 90 | 55.17 | 9.53% | 11.02% |
| 2016-11-09 | BTO | CWH | n | 29.00 | 30 | 80 | 31.48 | 8.55% | 10.66% |
| 2016-11-08 | RLH | SQZ | y | 8.71 | 9 | 85 | 9.4 | 7.92% | 7.92% |
| 2016-11-11 | QTWO | CWH | n | 29.95 | 32 | 84 | 32.1 | 7.18% | 7.78% |
| 2016-11-10 | KEYW | SQZ | y | 11.66 | 12 | 97 | 12.47 | 6.95% | 7.12% |
| 2016-11-10 | TRR | SQZ | y | 8.96 | 9 | 85 | 9.55 | 6.58% | 7.14% |
| 2016-11-11 | TRR | SQZ | y | 9.01 | 10 | 86 | 9.55 | 5.99% | 5.99% |
| 2016-11-09 | NMIH | CWH | n | 8.45 | 9 | 92 | 8.95 | 5.92% | 7.1% |
| 2016-11-10 | RM | SQZ | y | 22.56 | 23 | 91 | 23.85 | 5.72% | 6.21% |
| 2016-11-09 | KOP | CWH | n | 34.46 | 35 | 92 | 36.4 | 5.63% | 7.95% |
| 2016-11-10 | ATSG | CWH | n | 15.59 | 16 | 89 | 16.39 | 5.13% | 5.84% |
| 2016-11-09 | DORM | SQZ | y | 63.56 | 64 | 84 | 66.64 | 4.85% | 5.9% |
| 2016-11-09 | NSC | CWH | n | 97.19 | 99 | 81 | 100.91 | 3.83% | 4.12% |
| 2016-11-08 | TROX | SQZ | y | 9.42 | 10 | 98 | 9.77 | 3.72% | 6.05% |
| 2016-11-08 | NYMT | SQZ | y | 6.10 | 6 | 83 | 6.3 | 3.28% | 4.43% |
| 2016-11-10 | NDSN | CWH | n | 102.57 | 103 | 90 | 105.66 | 3.01% | 3.34% |
| 2016-11-10 | TMHC | CWH | y | 18.40 | 19 | 81 | 18.94 | 2.93% | 5.43% |
| 2016-11-09 | EBIX | DB | y | 58.56 | 59 | 92 | 60 | 2.46% | 2.46% |
| 2016-11-11 | ENVA | SQZ | y | 9.74 | 10 | 81 | 9.95 | 2.16% | 5.75% |
| 2016-11-10 | XNCR | SQZ | y | 22.27 | 22 | 95 | 22.71 | 1.98% | 3.19% |
| 2016-11-10 | HUBS | SQZ | y | 56.76 | 58 | 86 | 57.85 | 1.92% | 2.18% |
| 2016-11-11 | SMTC | SQZ | y | 25.81 | 26 | 83 | 26.3 | 1.9% | 2.67% |
| 2016-11-09 | MT | CWH | n | 6.90 | 7 | 86 | 7.03 | 1.88% | 6.09% |
| 2016-11-10 | PFG | CWH | n | 56.32 | 58 | 88 | 57.3 | 1.74% | 3.14% |
| 2016-11-10 | BKEP | CWH | n | 6.35 | 6 | 86 | 6.43 | 1.26% | 1.57% |
| 2016-11-11 | HCCI | SQZ | y | 14.06 | 14 | 89 | 14.15 | 0.64% | 2.06% |
| 2016-11-09 | JOY | CWH | n | 28.00 | 28 | 96 | 28.08 | 0.29% | 0.5% |
| 2016-11-09 | ININ | CWH | n | 60.45 | 60 | 96 | 60.45 | 0% | 0.13% |
| 2016-11-09 | NRZ | SQZ | y | 14.22 | 14 | 84 | 14.22 | 0% | 0.84% |
| 2016-11-09 | ORBK | CWH | n | 30.00 | 31 | 89 | 29.56 | -1.47% | 5.27% |
| *RS Rank on day before breakout. | |||||||||
| Symbol | BO Price |
BO Vol. |
Company | Industry | RS Rank |
Last Close |
|---|---|---|---|---|---|---|
| WLDN | 19.49 | 89,622 | Willdan Group - Inc. | Technical Services | 97 | 19.00 |
| EROS | 18.75 | 227,475 | Eros International PLC | Movie Production - Theaters | 95 | 17.95 |
| PCYG | 14.60 | 107,840 | Park City Group - Inc. | Business Software & Services | 94 | 14.10 |
| WMB | 31.85 | 10,520,181 | Williams Companies - Inc. (The) | Oil & Gas Pipelines | 93 | 30.10 |
| These stocks meet our suggested screening factors
for our Cup and Handle Chart Pattern watchlist. See Revised Rules for Trading Cup and Handle Breakouts |
||||||
| Index | Value | Change Week | Change YTD | Trend1 |
|---|---|---|---|---|
| Dow | 18847.7 |
5.36% | 8.16% | Up |
| NASDAQ | 5237.11 |
3.78% | 4.59% | Down |
| S&P 500 | 2164.45 |
3.8% | 5.9% | Down |
|
1The Market Trend is derived from
our proprietary market model. The market model is described on
the sitehere.
2The site also shows industry rankings based on fundamentals, combined technical and fundamentals, and on price alone. The site also shows daily industry movements. |
||||
| 1 Week | 13 Weeks | 26 Weeks | Year-to-Date |
|---|---|---|---|
| Dow Jones |
Dow Jones 0.08 % |
NASDAQ Composite 11.01 % |
Dow Jones 8.16 % |
| 1 Week | 3 Weeks | 13 Weeks | 26 Weeks |
|---|---|---|---|
| Sporting Goods Stores |
Sporting Goods Stores |
Manufactured Housing |
Silver |
| Basic Materials Wholesale 191 |
Toy & Hobby Stores 138 |
Foreign Money Center Banks 139 |
Manufactured Housing 212 |
| Charts of each industry rank and performance over 12 months are available on the site | |||
If you received this newsletter from a friend and you would like to receive it regularly please go to the BreakoutWatch.com site and you will then be able to register to receive the newsletter.
Copyright (c) 11/12/2016 NBIcharts, LLC dba BreakoutWatch.com. All
rights reserved.
" BreakoutWatch," the BreakoutWatch.com "eye" logo, and the slogan
"tomorrow's breakouts today" are service marks of NBIcharts LLC. All
other marks are the property of their respective owners, and are used
for descriptive purposes only.
BreakoutWatch is not affiliated with Investor's Business Daily or with Mr. William O'Neil. Our site, research and analysis is supported entirely by subscription and is free from advertising.