Breakoutwatch Weekly Summary 12/03/16
You are receiving this email because you are or were a BreakoutWatch.com subscriber, or have subscribed to our weekly newsletter. This newsletter summarizes the breakout events of the week and provides additional guidance that does not fit into our daily format. It is published each weekend.
Consolidation after a two week rise in stock prices caused the S&P 500 and NASDAQ to lose ground, while the stocks that are expected to profit from President-elect Trump's policies allowed the DJI to eke out a narrow gain. The NASDAQ was particularly hurt as investors rotated out of technology into larger cap DOW 30 investments. For the week the NASDAQ closed down 2.7% from last Friday's close. Friday's jobs report did allow some respite but the index failed to break through resistance at the 50 day moving average level. Higher volume this week allowed the number of breakouts to creep up to 18 from just 8 last week. The cup and handle pattern dominated with 14 breakouts although three Volatility Squeeze breakouts produced higher overall returns. 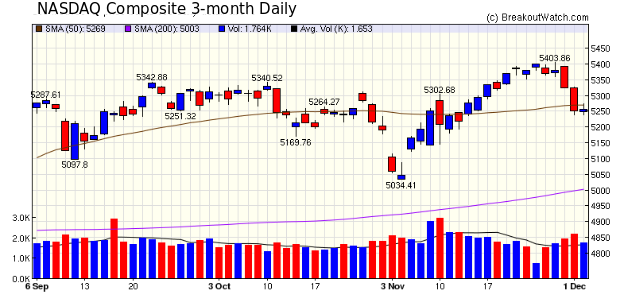 |
| TA charts now work for test Drive participants. |
| List | Breakouts | Avg. Gain |
|---|---|---|
| CWH | 14 | 2.54 |
| SQZ | 3 | 10.31 |
| HTF | 1 | 11.8 |
| HSB | 0 | |
| DB | 0 |
| Brkout Date | Symbol | Base | Squeeze | BrkoutOut Price | Brkout Day Close | RS Rank* | Last Close | Current % off BOP | Gain at Intraday High |
|---|---|---|---|---|---|---|---|---|---|
| 2016-12-01 | TLYS | CWH | n | 10.88 | 14 | 86 | 14.4 | 32.35% | 36.49% |
| 2016-11-30 | CRK | SQZ | y | 8.92 | 9 | 97 | 10.43 | 16.93% | 20.52% |
| 2016-11-29 | WLB | HTF | n | 17.37 | 18 | 98 | 19.42 | 11.8% | 12.61% |
| 2016-12-01 | CRK | SQZ | y | 9.47 | 10 | 94 | 10.43 | 10.14% | 13.52% |
| 2016-11-28 | HTHT | CWH | n | 48.14 | 51 | 88 | 52 | 8.02% | 9.76% |
| 2016-12-01 | KTOS | CWH | n | 7.39 | 7 | 91 | 7.94 | 7.44% | 7.58% |
| 2016-12-01 | EPM | CWH | n | 8.75 | 9 | 95 | 9.3 | 6.29% | 10.29% |
| 2016-11-30 | CLR | CWH | n | 54.32 | 58 | 82 | 57.61 | 6.06% | 11.01% |
| 2016-11-30 | CPE | CWH | n | 16.42 | 18 | 91 | 17.24 | 4.99% | 12.85% |
| 2016-12-01 | MPO | SQZ | y | 20.16 | 20 | 99 | 20.94 | 3.87% | 6.65% |
| 2016-11-29 | CRMT | CWH | n | 44.00 | 45 | 91 | 45.25 | 2.84% | 7.27% |
| 2016-11-30 | BBG | CWH | n | 7.55 | 8 | 85 | 7.76 | 2.78% | 8.21% |
| 2016-12-01 | CORR | CWH | n | 32.89 | 33 | 95 | 33.56 | 2.04% | 7.33% |
| 2016-12-01 | DTYS | CWH | n | 19.78 | 20 | 90 | 19.51 | -1.37% | 3.54% |
| 2016-12-01 | ESTE | CWH | n | 15.15 | 15 | 82 | 14.66 | -3.23% | 3.66% |
| 2016-11-29 | PCYG | CWH | n | 14.60 | 15 | 93 | 13.6 | -6.85% | 5.14% |
| 2016-11-28 | AOSL | CWH | n | 22.90 | 23 | 96 | 20.08 | -12.31% | 4.5% |
| 2016-11-28 | PRTO | CWH | n | 11.15 | 11 | 84 | 9.645 | -13.5% | 2.69% |
| *RS Rank on day before breakout. | |||||||||
| Symbol | BO Price |
BO Vol. |
Company | Industry | RS Rank |
Last Close |
|---|---|---|---|---|---|---|
| RYI | 14.85 | 535,688 | Ryerson Holding Corporation | Metal Fabrication | 98 | 14.75 |
| ZEUS | 27.38 | 193,192 | Olympic Steel - Inc. | Steel & Iron | 96 | 25.86 |
| SPAR | 9.20 | 212,877 | Spartan Motors - Inc. | Trucks & Other Vehicles | 96 | 8.55 |
| USDP | 14.60 | 47,014 | USD Partners LP | Railroads | 95 | 14.15 |
| CEQP | 22.80 | 467,510 | Crestwood Equity Partners LP | Oil & Gas Pipelines | 95 | 22.55 |
| SWC | 15.55 | 2,644,100 | Stillwater Mining Company | Industrial Metals & Minerals | 93 | 15.17 |
| BPI | 10.80 | 132,402 | Bridgepoint Education - Inc. | Education & Training Services | 92 | 10.30 |
| MSB | 11.65 | 50,270 | Mesabi Trust | Diversified Investments | 92 | 10.90 |
| ADES | 9.48 | 63,738 | Advanced Emissions Solutions - Inc. | Pollution & Treatment Controls | 92 | 9.30 |
| ISIL | 22.25 | 3,098,060 | Intersil Corporation | Semiconductor - Broad Line | 92 | 22.16 |
| These stocks meet our suggested screening factors
for our Cup and Handle Chart Pattern watchlist. See Revised Rules for Trading Cup and Handle Breakouts |
||||||
| Index | Value | Change Week | Change YTD | Trend1 |
|---|---|---|---|---|
| Dow | 19170.4 |
0.1% | 10.02% | Up |
| NASDAQ | 5255.65 |
-2.65% | 4.96% | Up |
| S&P 500 | 2191.95 |
-0.97% | 7.24% | Up |
|
1The Market Trend is derived from
our proprietary market model. The market model is described on
the sitehere.
2The site also shows industry rankings based on fundamentals, combined technical and fundamentals, and on price alone. The site also shows daily industry movements. |
||||
| 1 Week | 13 Weeks | 26 Weeks | Year-to-Date |
|---|---|---|---|
| Dow Jones |
Dow Jones 3.67 % |
Dow Jones 7.66 % |
Dow Jones 10.02 % |
| 1 Week | 3 Weeks | 13 Weeks | 26 Weeks |
|---|---|---|---|
| Manufactured Housing |
Regional - Southwest Banks |
Manufactured Housing |
Silver |
| Aerospace/Defense - Major Diversified 72 |
Dairy Products 128 |
Dairy Products 185 |
Manufactured Housing 215 |
| Charts of each industry rank and performance over 12 months are available on the site | |||
If you received this newsletter from a friend and you would like to receive it regularly please go to the BreakoutWatch.com site and you will then be able to register to receive the newsletter.
Copyright (c) 12/03/2016 NBIcharts, LLC dba BreakoutWatch.com. All
rights reserved.
" BreakoutWatch," the BreakoutWatch.com "eye" logo, and the slogan
"tomorrow's breakouts today" are service marks of NBIcharts LLC. All
other marks are the property of their respective owners, and are used
for descriptive purposes only.
BreakoutWatch is not affiliated with Investor's Business Daily or with Mr. William O'Neil. Our site, research and analysis is supported entirely by subscription and is free from advertising.