Breakoutwatch Weekly Summary 12/17/16
You are receiving this email because you are or were a BreakoutWatch.com subscriber, or have subscribed to our weekly newsletter. This newsletter summarizes the breakout events of the week and provides additional guidance that does not fit into our daily format. It is published each weekend.
| Our top performing breakout this week
(NL) came from a High Tight Flag pattern (see below). When I
'Googled' the term, I was pleased to see that the first image
Google displayed came from our High
Tight Flag methodology page. It was rewarding to see this
site so highly placed. As our methodology page says, these
patterns are infrequent but can be very profitable. Be sure to
read our 'Trading Hints' (reproduced below) before taking a punt
on a stock on our HTF list. The NASDAQ Composite moved sideways this week but heavy sell volume on Friday (1.7 times the 50 day average) drove the index to a loss for the week of 0.4%. Nevertheless, 19 breakouts were recorded with the cup and handle pattern (9) leading followed closely by the Volatility Squeeze pattern (8). Volumes are likely to be lighter over the next couple of weeks, so the number of breakouts (which require higher volume) will likely fall. 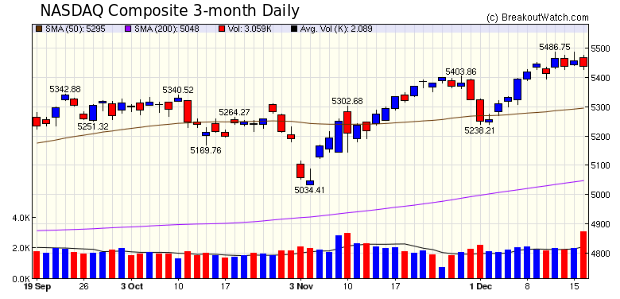 |
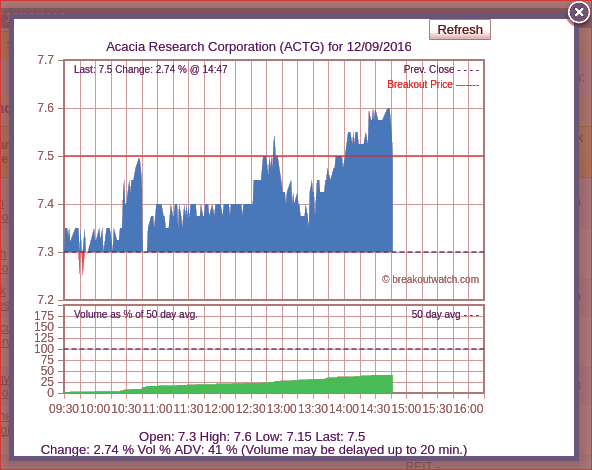
| A small enhancement to our
intraday chart was made to show the breakout price so
the viewer can see instantly if the price has been reached or
not. Here's an example:
 Intraday charts are directly
accessible from our Alerts page by clicking the alerted
symbol, or are accessible after generating a TA chart
(from the header on every page).
|
|
High Tight Flag
Trading Hints
The High Tight Flag can be very profitable but stocks should not be traded simply on the basis that they appear on the HTF watchlist. As with other breakout patterns, the watchlist provides a basis from which to do further research and there are three requirements before a trade should be entered:
Our due diligence tools allow you to make these evaluations. We suggest that you use these tools to prepare your own shortlist of stocks to monitor on the next trading day. The trade may be entered either during the day's trading or at the open on the day after breakout. In general, it's desirable to set a limit price and a stop price. Our Sell Assistant tool, and/or our Stock Timeliness Checkup tool can be used to time the exit of the trade. Important Caveat: Stocks that are takeover candidates can meet the criteria for this pattern. In this case, trading the stock should not be considered as the price is unlikely to move significantly higher and can fall dramatically if the takeover does not occur. We cannot determine a takeover candidate arithmetically, so use the 'news' link on the CE page for the stock for additional research. 1. Confirmed Breakout
There is no minimum volume requirement for a HTF breakout. As with other breakouts, the stock is not considered a breakout unless the price condition is met at the day's close.2. Excellent Technical Strength Because of the nature of the High Tight Flag, stocks meeting the requirements of this pattern will have excellent technical strength.3. Market Condition and Profitable Industry Groups In a bull market, most stocks tend to go up and in a bear market most stocks tend to go down. But in both markets there will be breakouts from a HTF pattern that give exceptional gains. Look at the industry group to which the stock belongs. Whether the market overall is rising or falling, there will be industry groups that are out-performing the market. Our daily market and industry analysis tells you which way the market is trending and our industry analysis tells you which industry groups are outperforming the market.Intra-Day Trading Monitoring a stock on the day after it appears on the watchlist may allow you to enter a trade while the stock is in the early stages of a breakout. If the breakout price is achieved and the volume is trending toward, or has exceeded, the breakout volume, then you may be able to enter a position at a much more favorable price than if you wait until the breakout is confirmed at the end of the day.Trading at the Open If a stock has successfully broken out at the end of the day, then it may be a candidate for trading at the open the next day, provided it meets the three additional requirements cited above. Stocks that have broken out are reported on the 'Recent Breakouts' report.Limit Price In general, a stock should not be purchased at more than 5% above the breakout price. Exceptions can be made if the stock gapped-up on exceptional volume.Stop Price After entering a position you should either place a stop order, or, if you can monitor the market in real-time, determine a mental stop so that if the trade goes against you, you will exit the position. While some authors suggest a 7-8% stop loss, we think the stop loss price should be based on the most recent support level for the stock. In the case of the cup-with-handle pattern, this is the low point of the handle. The stop should be placed just below this level. |
| List | Breakouts | Avg. Gain |
|---|---|---|
| CWH | 9 | 3.47 |
| SQZ | 8 | 2.87 |
| HTF | 1 | 11.68 |
| HSB | 1 | -9.59 |
| DB | 0 |
| Brkout Date | Symbol | Base | Squeeze | BrkoutOut Price | Brkout Day Close | RS Rank* | Last Close | Current % off BOP | Gain at Intraday High |
|---|---|---|---|---|---|---|---|---|---|
| 2016-12-12 | NL | HTF | n | 6.85 | 7 | 97 | 7.65 | 11.68% | 16.79% |
| 2016-12-16 | BREW | SQZ | y | 16.16 | 18 | 88 | 17.6 | 8.91% | 9.72% |
| 2016-12-16 | VSAR | CWH | y | 13.65 | 15 | 81 | 14.85 | 8.79% | 11.36% |
| 2016-12-15 | AQXP | SQZ | y | 15.49 | 18 | 94 | 16.59 | 7.1% | 18.44% |
| 2016-12-15 | DWSN | CWH | y | 8.33 | 9 | 94 | 8.82 | 5.88% | 6.84% |
| 2016-12-14 | DTYS | CWH | n | 20.48 | 21 | 86 | 21.66 | 5.76% | 7.32% |
| 2016-12-15 | GPRE | CWH | n | 28.25 | 29 | 88 | 29.65 | 4.96% | 5.31% |
| 2016-12-13 | ADES | CWH | y | 9.50 | 10 | 80 | 9.89 | 4.11% | 4.11% |
| 2016-12-15 | GNBC | CWH | y | 13.50 | 14 | 86 | 14 | 3.7% | 3.7% |
| 2016-12-16 | NGL | SQZ | y | 18.61 | 19 | 97 | 19.15 | 2.9% | 4.78% |
| 2016-12-16 | GNBC | SQZ | y | 13.61 | 14 | 88 | 14 | 2.87% | 2.87% |
| 2016-12-16 | PLOW | SQZ | y | 33.11 | 34 | 84 | 33.9 | 2.39% | 2.39% |
| 2016-12-16 | SPAR | CWH | n | 9.60 | 10 | 97 | 9.65 | 0.52% | 1.56% |
| 2016-12-16 | SUPN | SQZ | y | 23.66 | 24 | 82 | 23.75 | 0.38% | 3.13% |
| 2016-12-15 | VMW | SQZ | y | 80.93 | 83 | 82 | 80.79 | -0.17% | 2.56% |
| 2016-12-15 | HBP | CWH | n | 6.45 | 7 | 87 | 6.38 | -1.09% | 3.72% |
| 2016-12-12 | USDP | CWH | y | 14.60 | 15 | 95 | 14.4 | -1.37% | 5.82% |
| 2016-12-14 | CELP | SQZ | y | 10.93 | 11 | 82 | 10.77 | -1.46% | 6.95% |
| 2016-12-13 | KNDI | HSB | n | 5.42 | 6 | 8 | 4.9 | -9.59% | 4.24% |
| *RS Rank on day before breakout. | |||||||||
| Symbol | BO Price |
BO Vol. |
Company | Industry | RS Rank |
Last Close |
|---|---|---|---|---|---|---|
| RYI | 16.85 | 505,299 | Ryerson Holding Corporation | Metal Fabrication | 98 | 15.45 |
| MSB | 11.65 | 58,440 | Mesabi Trust | Diversified Investments | 96 | 11.20 |
| ZEUS | 28.67 | 210,603 | Olympic Steel - Inc. | Steel & Iron | 96 | 26.65 |
| ATW | 13.82 | 6,501,303 | Atwood Oceanics - Inc. | Oil & Gas Drilling & Exploration | 94 | 13.47 |
| EPE | 6.87 | 4,042,119 | EP Energy Corporation | Independent Oil & Gas | 92 | 6.50 |
| RYAM | 15.87 | 913,910 | Rayonier Advanced Materials Inc. | Chemicals - Major Diversified | 92 | 15.66 |
| JOY | 28.18 | 1,706,776 | Joy Global Inc. | Farm & Construction Machinery | 92 | 28.01 |
| These stocks meet our suggested screening factors
for our Cup and Handle Chart Pattern watchlist. See Revised Rules for Trading Cup and Handle Breakouts |
||||||
| Index | Value | Change Week | Change YTD | Trend1 |
|---|---|---|---|---|
| Dow | 19843.4 |
0.44% | 13.88% | Up |
| NASDAQ | 5437.16 |
-0.13% | 8.58% | Up |
| S&P 500 | 2258.07 |
-0.06% | 10.48% | Up |
|
1The Market Trend is derived from
our proprietary market model. The market model is described on
the sitehere.
2The site also shows industry rankings based on fundamentals, combined technical and fundamentals, and on price alone. The site also shows daily industry movements. |
||||
| 1 Week | 13 Weeks | 26 Weeks | Year-to-Date |
|---|---|---|---|
| Dow Jones |
Dow Jones 3.67 % |
NASDAQ Composite 13.27 % |
Dow Jones 13.88 % |
| 1 Week | 3 Weeks | 13 Weeks | 26 Weeks |
|---|---|---|---|
| Manufactured Housing |
Manufactured Housing |
Manufactured Housing |
Silver |
| Aerospace/Defense - Major Diversified 64 |
Aerospace/Defense - Major Diversified 118 |
Toy & Hobby Stores 204 |
Manufactured Housing 213 |
| Charts of each industry rank and performance over 12 months are available on the site | |||
If you received this newsletter from a friend and you would like to receive it regularly please go to the BreakoutWatch.com site and you will then be able to register to receive the newsletter.
Copyright (c) 12/17/2016 NBIcharts, LLC dba BreakoutWatch.com. All
rights reserved.
" BreakoutWatch," the BreakoutWatch.com "eye" logo, and the slogan
"tomorrow's breakouts today" are service marks of NBIcharts LLC. All
other marks are the property of their respective owners, and are used
for descriptive purposes only.
BreakoutWatch is not affiliated with Investor's Business Daily or with Mr. William O'Neil. Our site, research and analysis is supported entirely by subscription and is free from advertising.