Breakoutwatch Weekly Summary 01/28/17
You are receiving this email because you are or were a BreakoutWatch.com subscriber, or have subscribed to our weekly newsletter. This newsletter summarizes the breakout events of the week and provides additional guidance that does not fit into our daily format. It is published each weekend.
The NASDAQ led the three major indexes
to new highs with a gain of 1.9%. Volumes were at or above the 50
day average which produced a big uptick in confirmed breakouts to
25 with several showing breakout day gains of over 10%. Volatility
Squeeze (SQZ) breakouts were predominant, outnumbering cup
and handle pattern breakouts by 19 to 6. The reason for the
large number of SQZ breakouts can be found by observing that the
NASDAQ was trading in a narrow range in the previous week. A
narrow trading range implies low volatility so it was natural that
here should be many SQZ breakouts this week as the index responded
to generallly good earnings from the tech. sector.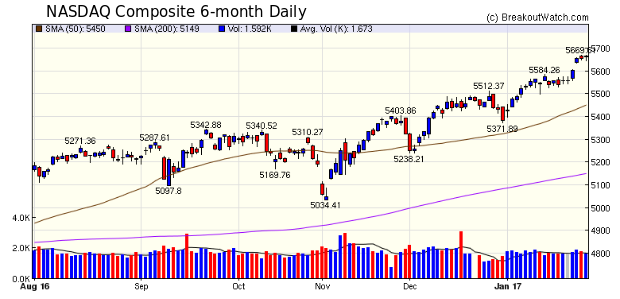 |
| No new features this week. |
|
Buy at Open Strategy
for those Who Cannot Monitor the Market in Real time
Determine the amount of your portfolio that you will trade on cup and handle pattern stocks.
 |
| List | Breakouts | Avg. Gain |
|---|---|---|
| CWH | 6 | 3.92 |
| SQZ | 19 | 4.44 |
| HTF | 0 | |
| HSB | 0 | |
| DB | 0 |
| Brkout Date | Symbol | Base | Squeeze | BrkoutOut Price | Brkout Day Close | RS Rank* | Last Close | Current % off BOP | Gain at Intraday High |
|---|---|---|---|---|---|---|---|---|---|
| 2017-01-23 | IIVI | SQZ | y | 30.86 | 31 | 89 | 36.25 | 17.47% | 21.68% |
| 2017-01-23 | CCLP | CWH | n | 11.39 | 12 | 89 | 12.67 | 11.24% | 18.88% |
| 2017-01-23 | NEFF | SQZ | y | 14.46 | 15 | 97 | 16 | 10.65% | 13.42% |
| 2017-01-23 | MRCY | SQZ | y | 31.15 | 31 | 88 | 34.21 | 9.82% | 13.16% |
| 2017-01-25 | UPLD | CWH | n | 10.98 | 11 | 92 | 11.95 | 8.83% | 10.02% |
| 2017-01-24 | AVHI | SQZ | y | 16.94 | 18 | 81 | 18 | 6.26% | 12.93% |
| 2017-01-24 | SMTC | SQZ | y | 32.11 | 33 | 89 | 33.7 | 4.95% | 5.57% |
| 2017-01-25 | TPC | SQZ | y | 29.46 | 32 | 96 | 30.8 | 4.55% | 12.02% |
| 2017-01-25 | STRL | SQZ | y | 8.84 | 9 | 91 | 9.19 | 3.96% | 7.24% |
| 2017-01-25 | MRVL | SQZ | y | 14.52 | 15 | 83 | 15.09 | 3.93% | 6.4% |
| 2017-01-27 | MX | CWH | n | 8.35 | 9 | 82 | 8.65 | 3.59% | 4.19% |
| 2017-01-27 | NEFF | SQZ | y | 15.51 | 16 | 97 | 16 | 3.16% | 5.74% |
| 2017-01-27 | ARLP | SQZ | y | 23.61 | 24 | 84 | 24.35 | 3.13% | 3.77% |
| 2017-01-25 | ESNT | SQZ | y | 33.31 | 34 | 89 | 34.31 | 3% | 4.41% |
| 2017-01-24 | FCX | CWH | n | 15.94 | 17 | 98 | 16.37 | 2.7% | 7.03% |
| 2017-01-25 | POWI | SQZ | y | 70.61 | 72 | 82 | 72.5 | 2.68% | 2.75% |
| 2017-01-25 | PH | SQZ | y | 145.49 | 150 | 82 | 149.27 | 2.6% | 3.2% |
| 2017-01-25 | MDR | SQZ | y | 7.89 | 8 | 97 | 8.06 | 2.15% | 5.58% |
| 2017-01-25 | TEX | SQZ | y | 32.49 | 33 | 92 | 33.11 | 1.91% | 4.25% |
| 2017-01-26 | BLBD | SQZ | y | 16.69 | 17 | 80 | 16.95 | 1.56% | 2.16% |
| 2017-01-25 | EXP | SQZ | y | 104.31 | 109 | 91 | 105.63 | 1.27% | 6.07% |
| 2017-01-27 | WAL | SQZ | y | 49.90 | 51 | 86 | 50.53 | 1.26% | 1.54% |
| 2017-01-25 | AXTI | CWH | n | 6.20 | 7 | 96 | 6.2 | 0% | 7.74% |
| 2017-01-25 | FCBC | SQZ | y | 30.15 | 31 | 88 | 30.14 | -0.03% | 2.35% |
| 2017-01-25 | RES | CWH | n | 22.28 | 22 | 91 | 21.65 | -2.83% | 4.85% |
| *RS Rank on day before breakout. | |||||||||
| Symbol | BO Price |
BO Vol. |
Company | Industry | RS Rank |
Last Close |
|---|---|---|---|---|---|---|
| CC | 25.63 | 5,548,918 | Chemours Company (The) | Specialty Chemicals | 99 | 25.39 |
| SAIA | 50.80 | 342,140 | Saia - Inc. | Trucking | 96 | 49.75 |
| OCLR | 10.35 | 8,821,546 | Oclaro - Inc. | Semiconductor Equipment & Materials | 96 | 9.96 |
| SLM | 11.87 | 5,868,050 | SLM Corporation | Credit Services | 95 | 11.79 |
| DCO | 31.11 | 145,182 | Ducommun Incorporated | Aerospace/Defense Products & Services | 95 | 29.28 |
| KOP | 43.35 | 185,656 | Koppers Holdings Inc. | Specialty Chemicals | 95 | 41.80 |
| ARCB | 32.50 | 500,304 | ArcBest Corporation | Trucking | 94 | 31.90 |
| HBHC | 46.70 | 1,257,411 | Hancock Holding Company | Regional - Southeast Banks | 94 | 45.70 |
| GTLS | 39.36 | 384,404 | Chart Industries - Inc. | Metal Fabrication | 94 | 38.55 |
| These stocks meet our suggested screening factors
for our Cup and Handle Chart Pattern watchlist. See Revised Rules for Trading Cup and Handle Breakouts |
||||||
| Index | Value | Change Week | Change YTD | Trend1 |
|---|---|---|---|---|
| Dow | 20093.8 |
1.34% | 1.68% | Up |
| NASDAQ | 5660.78 |
1.9% | 5.16% | Up |
| S&P 500 | 2294.69 |
1.03% | 2.5% | Up |
|
1The Market Trend is derived from
our proprietary market model. The market model is described on
the sitehere.
2The site also shows industry rankings based on fundamentals, combined technical and fundamentals, and on price alone. The site also shows daily industry movements. |
||||
| 1 Week | 13 Weeks | 26 Weeks | Year-to-Date |
|---|---|---|---|
| NASDAQ Composite |
Dow Jones 9.07 % |
NASDAQ Composite 9.66 % |
NASDAQ Composite 5.16 % |
| 1 Week | 3 Weeks | 13 Weeks | 26 Weeks |
|---|---|---|---|
| Basic Materials Wholesale |
Basic Materials Wholesale |
Manufactured Housing |
Manufactured Housing |
| Broadcasting - Radio 51 |
Recreational Vehicles 67 |
Long Distance Carriers 195 |
Basic Materials Wholesale 211 |
| Charts of each industry rank and performance over 12 months are available on the site | |||
If you received this newsletter from a friend and you would like to receive it regularly please go to the BreakoutWatch.com site and you will then be able to register to receive the newsletter.
Copyright (c) 01/28/2017 NBIcharts, LLC dba BreakoutWatch.com. All
rights reserved.
" BreakoutWatch," the BreakoutWatch.com "eye" logo, and the slogan
"tomorrow's breakouts today" are service marks of NBIcharts LLC. All
other marks are the property of their respective owners, and are used
for descriptive purposes only.
BreakoutWatch is not affiliated with Investor's Business Daily or with Mr. William O'Neil. Our site, research and analysis is supported entirely by subscription and is free from advertising.