Breakoutwatch Weekly Summary 02/04/17
You are receiving this email because you are or were a BreakoutWatch.com subscriber, or have subscribed to our weekly newsletter. This newsletter summarizes the breakout events of the week and provides additional guidance that does not fit into our daily format. It is published each weekend.
| Climate for Growth Stock Breakouts
Continues to Improve The NASDAQ Composite returned to a narrow trading range and lies at the upper limit of the medium term trend line. I expect the upward trend to continue and perhaps accelerate due to three important events this week:
All three will greatly please Wall street who can expect legislation to follow which will lighten their regulatory burden and spur further investment, particularly as the Volcker rule is relaxed and depositor's cash becomes more available for speculation. The outlook for more and more profitable breakouts is therefore strong. 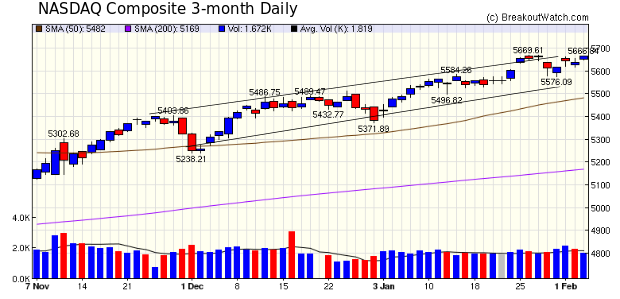 |
No new features this week. |
| List | Breakouts | Avg. Gain |
|---|---|---|
| CWH | 7 | 2.74 |
| SQZ | 9 | 6.3 |
| HTF | 0 | |
| HSB | 0 | |
| DB | 0 |
| Brkout Date | Symbol | Base | Squeeze | BrkoutOut Price | Brkout Day Close | RS Rank* | Last Close | Current % off BOP | Gain at Intraday High |
|---|---|---|---|---|---|---|---|---|---|
| 2017-02-02 | BRKS | SQZ | y | 17.72 | 20 | 94 | 20.75 | 17.1% | 18.4% |
| 2017-02-02 | ARCO | SQZ | y | 6.11 | 6 | 84 | 6.5 | 6.38% | 7.69% |
| 2017-02-01 | SF | SQZ | y | 50.34 | 52 | 87 | 53.53 | 6.34% | 6.67% |
| 2017-01-31 | GKOS | CWH | n | 41.00 | 41 | 93 | 43.59 | 6.32% | 6.76% |
| 2017-02-03 | VBTX | SQZ | y | 27.62 | 29 | 95 | 29.25 | 5.9% | 6.19% |
| 2017-02-02 | SLAB | SQZ | y | 69.26 | 70 | 81 | 73.1 | 5.54% | 5.62% |
| 2017-01-30 | AHGP | SQZ | y | 28.97 | 30 | 84 | 30.45 | 5.11% | 5.97% |
| 2017-02-03 | MTU | CWH | y | 6.60 | 7 | 80 | 6.92 | 4.85% | 6.21% |
| 2017-01-31 | MKTX | CWH | n | 182.86 | 187 | 82 | 191.27 | 4.6% | 4.62% |
| 2017-02-03 | SLAB | SQZ | y | 70.26 | 73 | 83 | 73.1 | 4.04% | 4.11% |
| 2017-02-01 | KWR | SQZ | y | 128.51 | 132 | 86 | 132.79 | 3.33% | 7.47% |
| 2017-02-03 | AMP | SQZ | y | 117.74 | 121 | 81 | 121.26 | 2.99% | 3.5% |
| 2017-02-01 | CFX | CWH | n | 40.22 | 41 | 83 | 41.4 | 2.93% | 4.4% |
| 2017-02-01 | WD | CWH | y | 32.43 | 32 | 82 | 32.95 | 1.6% | 1.67% |
| 2017-02-02 | MX | CWH | n | 8.75 | 9 | 94 | 8.75 | 0% | 1.71% |
| 2017-02-01 | SPNC | CWH | y | 26.15 | 27 | 89 | 25.85 | -1.15% | 4.78% |
| *RS Rank on day before breakout. | |||||||||
| Symbol | BO Price |
BO Vol. |
Company | Industry | RS Rank |
Last Close |
|---|---|---|---|---|---|---|
| NRP | 39.85 | 74,398 | Natural Resource Partners LP | Industrial Metals & Minerals | 97 | 37.00 |
| BOOM | 16.80 | 65,259 | DMC Global Inc. | Metal Fabrication | 96 | 16.71 |
| CVGI | 6.25 | 164,404 | Commercial Vehicle Group - Inc. | Auto Parts Wholesale | 96 | 6.18 |
| SLM | 12.16 | 5,808,268 | SLM Corporation | Credit Services | 96 | 12.04 |
| STS | 19.90 | 264,314 | Supreme Industries - Inc. | Trucks & Other Vehicles | 96 | 18.35 |
| SAIA | 50.80 | 342,438 | Saia - Inc. | Trucking | 95 | 49.45 |
| DCO | 31.47 | 140,535 | Ducommun Incorporated | Aerospace/Defense Products & Services | 95 | 30.05 |
| MTZ | 41.90 | 1,269,045 | MasTec - Inc. | Heavy Construction | 95 | 38.90 |
| HBHC | 47.20 | 1,258,448 | Hancock Holding Company | Regional - Southeast Banks | 95 | 46.45 |
| OCLR | 10.35 | 9,269,266 | Oclaro - Inc. | Semiconductor Equipment & Materials | 94 | 9.81 |
| These stocks meet our suggested screening factors
for our Cup and Handle Chart Pattern watchlist. See Revised Rules for Trading Cup and Handle Breakouts |
||||||
| Index | Value | Change Week | Change YTD | Trend1 |
|---|---|---|---|---|
| Dow | 20071.5 |
-0.11% | 1.56% | Up |
| NASDAQ | 5666.77 |
0.11% | 5.27% | Up |
| S&P 500 | 2297.42 |
0.12% | 2.62% | Up |
|
1The Market Trend is derived from
our proprietary market model. The market model is described on
the sitehere.
2The site also shows industry rankings based on fundamentals, combined technical and fundamentals, and on price alone. The site also shows daily industry movements. |
||||
| 1 Week | 13 Weeks | 26 Weeks | Year-to-Date |
|---|---|---|---|
| S&P 500 |
NASDAQ Composite 12.29 % |
NASDAQ Composite 8.54 % |
NASDAQ Composite 5.27 % |
| 1 Week | 3 Weeks | 13 Weeks | 26 Weeks |
|---|---|---|---|
| Basic Materials Wholesale |
Basic Materials Wholesale |
Regional - Southwest Banks |
Manufactured Housing |
| Publishing - Periodicals 107 |
Publishing - Periodicals 99 |
Long Distance Carriers 199 |
Long Distance Carriers 211 |
| Charts of each industry rank and performance over 12 months are available on the site | |||
If you received this newsletter from a friend and you would like to receive it regularly please go to the BreakoutWatch.com site and you will then be able to register to receive the newsletter.
Copyright (c) 02/04/2017 NBIcharts, LLC dba BreakoutWatch.com. All
rights reserved.
" BreakoutWatch," the BreakoutWatch.com "eye" logo, and the slogan
"tomorrow's breakouts today" are service marks of NBIcharts LLC. All
other marks are the property of their respective owners, and are used
for descriptive purposes only.
BreakoutWatch is not affiliated with Investor's Business Daily or with Mr. William O'Neil. Our site, research and analysis is supported entirely by subscription and is free from advertising.