Breakoutwatch Weekly Summary 02/18/17
You are receiving this email because you are or were a BreakoutWatch.com subscriber, or have subscribed to our weekly newsletter. This newsletter summarizes the breakout events of the week and provides additional guidance that does not fit into our daily format. It is published each weekend.
The NASDAQ rose 1.8% this week and has racked up 8.5% since the start of the year. The index again closed the week on a record high. The week's gains came in spite of Janet Yellen's testimony to Congress that another interest rate hike may come as early as March. Normally, this would have put a brake on market activity, but instead markets moved higher after her testimony as it implied interest rates will rise in response to stronger economic growth. Markets are anticipating, even before any legislation is introduced, that "yuge" growth benefits will come from infrastructure spending, less bank regulation, and corporate and individual tax cuts. Is this "irrational exuberance"? We shall see, but make hay while the sun shines. Cup and Handle pattern and Volatility Squeeze breakouts delivered average gains of 4.5% this week. 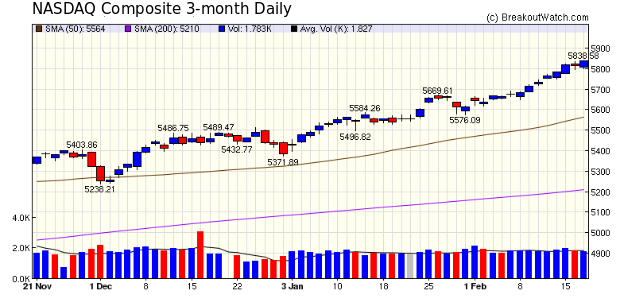 |
| No new features this week. A bug in the display of short sale candidates (head and shoulder top and 50-day breakdowns) was corrected. |
| List | Breakouts | Avg. Gain |
|---|---|---|
| CWH | 10 | 4.34 |
| SQZ | 12 | 4.71 |
| HTF | 0 | |
| HSB | 0 | |
| DB | 1 | -0.8 |
| Brkout Date | Symbol | Base | Squeeze | BrkoutOut Price | Brkout Day Close | RS Rank* | Last Close | Current % off BOP | Gain at Intraday High |
|---|---|---|---|---|---|---|---|---|---|
| 2017-02-14 | CRBP | SQZ | y | 7.49 | 8 | 99 | 8.85 | 18.16% | 22.83% |
| 2017-02-16 | NTES | CWH | n | 266.15 | 299 | 86 | 297.25 | 11.69% | 12.6% |
| 2017-02-16 | PTCT | SQZ | y | 12.77 | 14 | 90 | 14.16 | 10.88% | 12.84% |
| 2017-02-15 | TRUE | SQZ | y | 13.24 | 13 | 93 | 14.38 | 8.61% | 15.26% |
| 2017-02-16 | CRAI | SQZ | y | 34.89 | 38 | 82 | 37.28 | 6.85% | 14.65% |
| 2017-02-14 | OCLR | CWH | n | 10.35 | 11 | 94 | 11.02 | 6.47% | 7.15% |
| 2017-02-16 | RUSHA | SQZ | y | 32.93 | 34 | 90 | 34.85 | 5.83% | 6.07% |
| 2017-02-17 | CRBP | CWH | n | 8.40 | 9 | 99 | 8.85 | 5.36% | 8.33% |
| 2017-02-17 | IMMR | SQZ | y | 10.97 | 12 | 85 | 11.51 | 4.92% | 5.93% |
| 2017-02-15 | YZC | CWH | n | 7.82 | 8 | 82 | 8.17 | 4.48% | 4.48% |
| 2017-02-15 | NRP | CWH | y | 39.36 | 41 | 98 | 41.1 | 4.42% | 6.58% |
| 2017-02-17 | BCOR | SQZ | y | 15.36 | 16 | 91 | 15.9 | 3.52% | 5.14% |
| 2017-02-13 | CPA | CWH | n | 100.23 | 103 | 88 | 103.41 | 3.17% | 6.07% |
| 2017-02-13 | CSTM | CWH | n | 7.95 | 8 | 83 | 8.2 | 3.14% | 8.81% |
| 2017-02-17 | RUSHA | SQZ | y | 34.03 | 35 | 92 | 34.85 | 2.41% | 2.64% |
| 2017-02-14 | BEAT | CWH | n | 24.45 | 25 | 92 | 24.95 | 2.04% | 6.09% |
| 2017-02-14 | EMKR | CWH | y | 9.95 | 10 | 97 | 10.15 | 2.01% | 4.52% |
| 2017-02-16 | PUB | SQZ | y | 25.81 | 26 | 86 | 26.25 | 1.7% | 2.09% |
| 2017-02-14 | ACAD | CWH | n | 39.04 | 40 | 87 | 39.28 | 0.61% | 3.71% |
| 2017-02-15 | HCCI | SQZ | y | 15.46 | 16 | 85 | 15.4 | -0.39% | 0.58% |
| 2017-02-15 | FANG | DB | y | 108.50 | 112 | 70 | 107.63 | -0.8% | 5.07% |
| 2017-02-15 | GUID | SQZ | y | 7.46 | 8 | 84 | 7.33 | -1.74% | 2.55% |
| 2017-02-14 | PTEN | SQZ | y | 28.63 | 29 | 93 | 27.43 | -4.19% | 3.95% |
| *RS Rank on day before breakout. | |||||||||
| Symbol | BO Price |
BO Vol. |
Company | Industry | RS Rank |
Last Close |
|---|---|---|---|---|---|---|
| STS | 19.90 | 273,230 | Supreme Industries - Inc. | Trucks & Other Vehicles | 95 | 18.08 |
| HSC | 14.60 | 694,560 | Harsco Corporation | Industrial Metals & Minerals | 94 | 14.00 |
| These stocks meet our suggested screening
factors for our Cup and Handle Chart Pattern watchlist. See Revised Rules for Trading Cup and Handle Breakouts |
||||||
| Index | Value | Change Week | Change YTD | Trend1 |
|---|---|---|---|---|
| Dow | 20624.1 |
1.75% | 4.36% | Up |
| NASDAQ | 5838.58 |
1.82% | 8.46% | Up |
| S&P 500 | 2351.16 |
1.51% | 5.02% | Up |
|
1The Market Trend is derived from
our proprietary market model. The market model is described
on the sitehere.
2The site also shows industry rankings based on fundamentals, combined technical and fundamentals, and on price alone. The site also shows daily industry movements. |
||||
| 1 Week | 13 Weeks | 26 Weeks | Year-to-Date |
|---|---|---|---|
| NASDAQ Composite |
NASDAQ Composite 9.72 % |
NASDAQ Composite 11.46 % |
NASDAQ Composite 8.46 % |
| 1 Week | 3 Weeks | 13 Weeks | 26 Weeks |
|---|---|---|---|
| Consumer Services |
Consumer Services |
Regional - Southwest Banks |
Manufactured Housing |
| Investment Brokerage - Regional 83 |
Publishing - Periodicals 97 |
Long Distance Carriers 148 |
Long Distance Carriers 212 |
| Charts of each industry rank and performance over 12 months are available on the site | |||
If you received this newsletter from a friend and you would like to receive it regularly please go to the BreakoutWatch.com site and you will then be able to register to receive the newsletter.
Copyright (c) 02/18/2017 NBIcharts, LLC dba BreakoutWatch.com. All
rights reserved.
" BreakoutWatch," the BreakoutWatch.com "eye" logo, and the slogan
"tomorrow's breakouts today" are service marks of NBIcharts LLC. All
other marks are the property of their respective owners, and are used
for descriptive purposes only.
BreakoutWatch is not affiliated with Investor's Business Daily or with Mr. William O'Neil. Our site, research and analysis is supported entirely by subscription and is free from advertising.