Breakoutwatch Weekly Summary 04/01/17
You are receiving this email because you are or were a BreakoutWatch.com subscriber, or have subscribed to our weekly newsletter. This newsletter summarizes the breakout events of the week and provides additional guidance that does not fit into our daily format. It is published each weekend.
| NASDAQ Sets up a Possible Head and
Shoulders Top The NASDAQ Composite gained 1.4% this week, easily outpacing the S&P 500 which gained 0.8%. Also, the NASDAQ easily leads with a year-to-date gain of 9.8% compared to the S&P's 5.5%. Despite investors concerns over the ability of the Trump administration to deliver health care and tax reform, and infrastructure spending, the NASDAQ rose steadily throughout the week, although it did so on generally less than average volume, a warning sign of investor caution. On Friday, the NASDAQ just failed to set a new high before pulling back and closing for a small loss on the day. This sets up a possible head and shoulders top as shown on this chart. Note that this pattern has a downward sloping neckline, so the pattern will be completed if the price drops below the left shoulder - the dotted line on the chart. A completed head and shoulder top pattern is a bearish signal, so beware if the NASDAQ price falls below 5812. The upward trend for the week produced 20 breakouts that are shown below, mostly from a Volatility Squeeze pattern. Volatility Squeezes occur when volume slows which reduces volatility. You can see from the chart that volume has been mostly below average for the last two weeks, which explains the prevalence of VS breakouts. 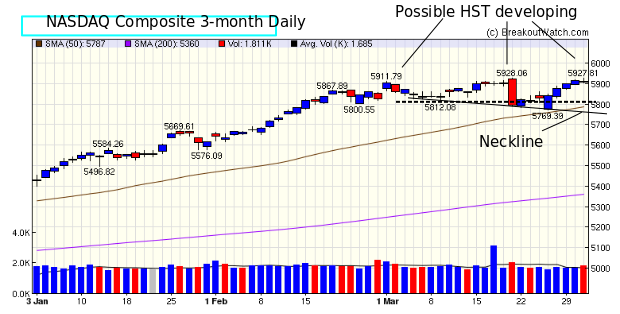 |
| No new features this week.
|
| List | Breakouts | Avg. Gain |
|---|---|---|
| CWH | 7 | 3.32 |
| SQZ | 11 | 3.43 |
| HTF | 2 | 2.59 |
| HSB | 0 | |
| DB | 0 |
| Brkout Date | Symbol | Base | Squeeze | BrkoutOut Price | Brkout Day Close | RS Rank* | Last Close | Current % off BOP | Gain at Intraday High |
|---|---|---|---|---|---|---|---|---|---|
| 2017-03-28 | OMER | SQZ | y | 12.68 | 14 | 83 | 15.12 | 19.24% | 29.34% |
| 2017-03-30 | ACLS | CWH | n | 16.80 | 18 | 88 | 18.8 | 11.9% | 12.5% |
| 2017-03-30 | NLNK | HTF | n | 22.92 | 23 | 97 | 24.1 | 5.15% | 8.42% |
| 2017-03-27 | GNBC | SQZ | y | 16.96 | 17 | 95 | 17.8 | 4.95% | 7.75% |
| 2017-03-30 | SLP | CWH | n | 11.25 | 11 | 85 | 11.75 | 4.44% | 4.44% |
| 2017-03-27 | JBSS | CWH | n | 70.14 | 70 | 81 | 73.19 | 4.35% | 4.83% |
| 2017-03-30 | GNBC | SQZ | y | 17.11 | 18 | 95 | 17.8 | 4.03% | 6.81% |
| 2017-03-29 | EDN | SQZ | y | 33.48 | 35 | 96 | 34.8 | 3.94% | 4.48% |
| 2017-03-31 | AXGN | SQZ | y | 10.14 | 10 | 88 | 10.45 | 3.06% | 4.54% |
| 2017-03-29 | PCH | SQZ | y | 44.86 | 45 | 82 | 45.7 | 1.87% | 2.54% |
| 2017-03-29 | CRCM | CWH | n | 12.30 | 12 | 92 | 12.51 | 1.71% | 5.45% |
| 2017-03-31 | TWOU | CWH | y | 39.07 | 40 | 86 | 39.66 | 1.51% | 3.35% |
| 2017-03-29 | NVTA | CWH | n | 10.96 | 11 | 85 | 11.06 | 0.91% | 3.1% |
| 2017-03-30 | LBRDK | SQZ | y | 85.78 | 87 | 83 | 86.4 | 0.72% | 1.83% |
| 2017-03-31 | PDFS | SQZ | y | 22.49 | 23 | 85 | 22.62 | 0.58% | 1.29% |
| 2017-03-28 | TRUE | SQZ | y | 15.46 | 16 | 96 | 15.47 | 0.06% | 3.23% |
| 2017-03-27 | AAOI | HTF | n | 56.14 | 60 | 99 | 56.15 | 0.02% | 7.21% |
| 2017-03-30 | SALM | SQZ | y | 7.46 | 8 | 80 | 7.45 | -0.13% | 3.89% |
| 2017-03-30 | NVTA | SQZ | y | 11.12 | 11 | 89 | 11.06 | -0.54% | 1.62% |
| 2017-03-30 | GNK | CWH | n | 12.70 | 13 | 98 | 12.5 | -1.57% | 3.39% |
| *RS Rank on day before breakout. | |||||||||
| Symbol | BO Price |
BO Vol. |
Company | Industry | RS Rank |
Last Close |
|---|---|---|---|---|---|---|
| COHR | 206.16 | 556,100 | Coherent - Inc. | Scientific & Technical Instruments | 97 | 205.94 |
| EDN | 34.98 | 87,536 | Empresa Distribuidora Y Comercializadora Norte S.A | Electric Utilities | 95 | 34.32 |
| These stocks meet our suggested screening factors
for our Cup and Handle Chart Pattern watchlist. See Revised Rules for Trading Cup and Handle Breakouts |
||||||
| Index | Value | Change Week | Change YTD | Trend1 |
|---|---|---|---|---|
| Dow | 20663.2 |
0.32% | 4.56% | Up |
| NASDAQ | 5911.74 |
1.42% | 9.82% | Up |
| S&P 500 | 2362.72 |
0.8% | 5.53% | Up |
|
1The Market Trend is derived from
our proprietary market model. The market model is described on
the sitehere.
2The site also shows industry rankings based on fundamentals, combined technical and fundamentals, and on price alone. The site also shows daily industry movements. |
||||
| 1 Week | 13 Weeks | 26 Weeks | Year-to-Date |
|---|---|---|---|
| NASDAQ Composite |
NASDAQ Composite 4.56 % |
Dow Jones 12.86 % |
NASDAQ Composite 9.82 % |
| 1 Week | 3 Weeks | 13 Weeks | 26 Weeks |
|---|---|---|---|
| Consumer Services |
General Entertainment |
Consumer Services |
Regional - Southwest Banks |
| Advertising Agencies 77 |
Advertising Agencies 95 |
Beverages - Wineries & Distillers 129 |
Long Distance Carriers 202 |
| Charts of each industry rank and performance over 12 months are available on the site | |||
If you received this newsletter from a friend and you would like to receive it regularly please go to the BreakoutWatch.com site and you will then be able to register to receive the newsletter.
Copyright (c) 04/01/2017 NBIcharts, LLC dba BreakoutWatch.com. All
rights reserved.
" BreakoutWatch," the BreakoutWatch.com "eye" logo, and the slogan
"tomorrow's breakouts today" are service marks of NBIcharts LLC. All
other marks are the property of their respective owners, and are used
for descriptive purposes only.
BreakoutWatch is not affiliated with Investor's Business Daily or with Mr. William O'Neil. Our site, research and analysis is supported entirely by subscription and is free from advertising.