Breakoutwatch Weekly Summary 05/13/17
You are receiving this email because you are or were a BreakoutWatch.com subscriber, or have subscribed to our weekly newsletter. This newsletter summarizes the breakout events of the week and provides additional guidance that does not fit into our daily format. It is published each weekend.
| The NASDAQ Composite was the only
major index to close with a positive gain this week as it hit a
new high on Tuesday. The remainder of the week showed increasing
uncertainty, however, as each day showed a doji
candlestick on declining volume. The NASDAQ was buoyed by
technology stocks such as Amazon, Apple and Nvidia, while
the S&P 500 and DJI were held back by losses in retail
and an increasing belief that the Trump rally is over, if
it ever existed, as tax, infrastructure and health care
initiatives are delayed. Breakouts from a cup and handle pattern continued to dominate the weeks breakouts with 18 out of 24 coming from that pattern. Of the 18, 4 met our suggested minimum RS Rank requirement of 94 and gained an average 7.2% by Friday's close, compared with a 2.3% gain for all CWH breakouts. If you are not familiar with our suggested cup and handle strategy, then read it here. This newsletter always shows the cup and handle stocks meeting these criteria as of Friday's close below as Top Rated Cup and Handle Stocks. 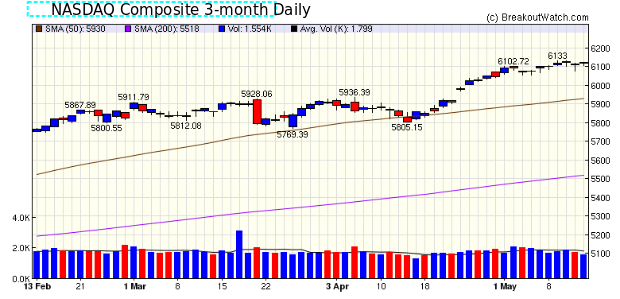 |
| I am converting the suite to always use the secure HTTPS protocol which is a Google recommendation. If you find some internal links are not working, please email me and let me now at mike@breakoutwatch.com |
|
Our latest strategy
suggestions are here.
|
| List | Breakouts | Avg. Gain |
|---|---|---|
| CWH | 18 | 2.33 |
| SQZ | 5 | 0.64 |
| HTF | 0 | |
| HSB | 0 | |
| DB | 1 | 16.26 |
| Brkout Date | Symbol | Base | Squeeze | BrkoutOut Price | Brkout Day Close | RS Rank* | Last Close | Current % off BOP | Gain at Intraday High |
|---|---|---|---|---|---|---|---|---|---|
| 2017-05-08 | W | CWH | n | 49.75 | 51 | 80 | 60.68 | 21.97% | 32.26% |
| 2017-05-10 | NVDA | DB | n | 110.00 | 121 | 96 | 127.89 | 16.26% | 18.57% |
| 2017-05-10 | NL | CWH | n | 9.05 | 9 | 99 | 10.45 | 15.47% | 17.68% |
| 2017-05-11 | SRT | CWH | n | 9.53 | 10 | 93 | 10.48 | 9.97% | 14.17% |
| 2017-05-08 | SINA | CWH | n | 78.71 | 80 | 82 | 83.5 | 6.09% | 6.85% |
| 2017-05-09 | INWK | CWH | n | 11.00 | 12 | 80 | 11.57 | 5.18% | 8.55% |
| 2017-05-09 | APPF | SQZ | y | 26.86 | 28 | 93 | 28.1 | 4.62% | 6.38% |
| 2017-05-08 | RPD | CWH | n | 17.43 | 18 | 88 | 18.19 | 4.36% | 9.52% |
| 2017-05-11 | REI | CWH | y | 12.99 | 13 | 85 | 13.5 | 3.93% | 5.23% |
| 2017-05-08 | ASYS | CWH | n | 7.48 | 8 | 88 | 7.75 | 3.61% | 16.98% |
| 2017-05-11 | ORBK | CWH | n | 35.84 | 37 | 82 | 37.03 | 3.32% | 4.52% |
| 2017-05-12 | HIIQ | CWH | n | 21.65 | 22 | 99 | 22.3 | 3% | 5.45% |
| 2017-05-10 | MCHP | CWH | n | 77.32 | 79 | 84 | 79 | 2.17% | 3.72% |
| 2017-05-10 | HLI | SQZ | y | 33.98 | 36 | 88 | 34.48 | 1.47% | 7.86% |
| 2017-05-09 | PTLA | CWH | n | 40.99 | 42 | 96 | 41.5 | 1.24% | 4.27% |
| 2017-05-08 | LOB | CWH | n | 24.75 | 25 | 92 | 25.05 | 1.21% | 3.64% |
| 2017-05-10 | MITK | CWH | n | 8.80 | 9 | 87 | 8.9 | 1.14% | 2.27% |
| 2017-05-08 | XLNX | CWH | n | 63.80 | 65 | 81 | 64.3 | 0.78% | 2.21% |
| 2017-05-08 | KERX | SQZ | y | 6.51 | 7 | 86 | 6.54 | 0.46% | 8.14% |
| 2017-05-08 | STRL | CWH | n | 10.90 | 11 | 96 | 10.92 | 0.18% | 3.67% |
| 2017-05-10 | NTES | SQZ | y | 271.91 | 279 | 88 | 271.29 | -0.23% | 6.54% |
| 2017-05-09 | OKSB | SQZ | y | 25.86 | 26 | 84 | 25.05 | -3.13% | 0.73% |
| 2017-05-08 | MEET | CWH | n | 6.11 | 6 | 87 | 5.03 | -17.68% | 5.56% |
| 2017-05-09 | HCKT | CWH | n | 20.18 | 20 | 87 | 15.32 | -24.08% | 0.89% |
| *RS Rank on day before breakout. | |||||||||
| Symbol | BO Price |
BO Vol. |
Company | Industry | RS Rank |
Last Close |
|---|---|---|---|---|---|---|
| LMIA | 14.00 | 87,741 | LMI Aerospace - Inc. | Aerospace/Defense Products & Services | 96 | 13.95 |
| FRBK | 9.10 | 342,884 | Republic First Bancorp - Inc. | Regional - Northeast Banks | 96 | 8.80 |
| STRL | 11.30 | 204,260 | Sterling Construction Company Inc | Heavy Construction | 95 | 10.92 |
| FSTR | 18.35 | 91,126 | L.B. Foster Company | Railroads | 94 | 18.15 |
| These stocks meet our suggested screening factors
for our Cup and Handle Chart Pattern watchlist. See Revised Rules for Trading Cup and Handle Breakouts |
||||||
| Index | Value | Change Week | Change YTD | Trend1 |
|---|---|---|---|---|
| Dow | 20896.6 |
-0.53% | 5.74% | Up |
| NASDAQ | 6121.23 |
0.34% | 13.71% | Up |
| S&P 500 | 2390.9 |
-0.35% | 6.79% | Up |
|
1The Market Trend is derived from
our proprietary market model. The market model is described on
the sitehere.
2The site also shows industry rankings based on fundamentals, combined technical and fundamentals, and on price alone. The site also shows daily industry movements. |
||||
| 1 Week | 13 Weeks | 26 Weeks | Year-to-Date |
|---|---|---|---|
| NASDAQ Composite |
NASDAQ Composite 6.75 % |
NASDAQ Composite 16.88 % |
NASDAQ Composite 13.71 % |
| 1 Week | 3 Weeks | 13 Weeks | 26 Weeks |
|---|---|---|---|
| Consumer Services |
Consumer Services |
Consumer Services |
Consumer Services |
| Data Storage Devices 76 |
Hospitals 106 |
Computers Wholesale 199 |
Computers Wholesale 167 |
| Charts of each industry rank and performance over 12 months are available on the site | |||
If you received this newsletter from a friend and you would like to receive it regularly please go to the BreakoutWatch.com site and you will then be able to register to receive the newsletter.
Copyright (c) 05/13/2017 NBIcharts, LLC dba BreakoutWatch.com. All
rights reserved.
" BreakoutWatch," the BreakoutWatch.com "eye" logo, and the slogan
"tomorrow's breakouts today" are service marks of NBIcharts LLC. All
other marks are the property of their respective owners, and are used
for descriptive purposes only.
BreakoutWatch is not affiliated with Investor's Business Daily or with Mr. William O'Neil. Our site, research and analysis is supported entirely by subscription and is free from advertising.