Breakoutwatch Weekly Summary 05/27/17
You are receiving this email because you are or were a BreakoutWatch.com subscriber, or have subscribed to our weekly newsletter. This newsletter summarizes the breakout events of the week and provides additional guidance that does not fit into our daily format. It is published each weekend.
| The NASDAQ continued to outpace the
other major indexes with a gain of 2.1%, setting a new high on
Thursday of 6217. The index rose each day except for Friday as the
Memorial day weekend got underway. Volumes were mostly just below
average except for Thursday when markets reacted favorably to the
minutes of the May FOMC in which the Fed showed confidence in the
economy by announcing a plan to unwind its huge balance sheet. The number of breakouts fell to just 9 this week. While lower than average volumes accounts for some of the lower number, the most important reason is that as stocks set new highs, there are fewer emerging from breakout patterns. For example, on Friday there were just 69 stocks on the cup-and-handle pattern watchlist compared to a high in May of 181 on May 4. Similarly, there were just 6 Volatility Squeeze candidates compared to a month's high of 31. 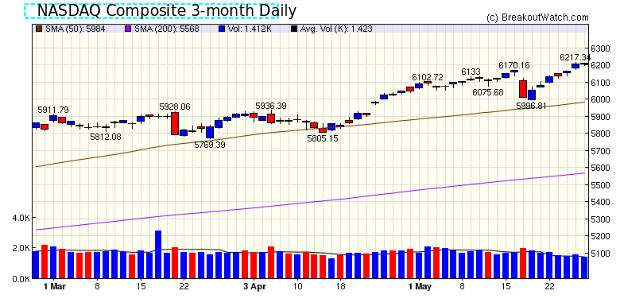 |
| Subscribers who use the Personal Watchlist feature can now filter the "Alerts Issued Today" page to view just their watchlist stocks by entering an '@' into the Search bar. If there were no alerts corresponding to any of the subscriber's PWL's then "No matching records found" will be displayed. 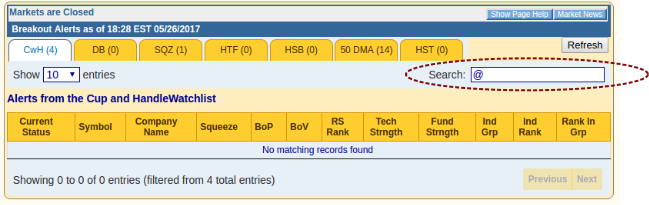 |
| List | Breakouts | Avg. Gain |
|---|---|---|
| CWH | 5 | 1.75 |
| SQZ | 3 | 11.81 |
| HTF | 1 | -0.88 |
| HSB | 0 | |
| DB | 0 |
| Brkout Date | Symbol | Base | Squeeze | BrkoutOut Price | Brkout Day Close | RS Rank* | Last Close | Current % off BOP | Gain at Intraday High |
|---|---|---|---|---|---|---|---|---|---|
| 2017-05-22 | COOL | SQZ | y | 13.66 | 17 | 99 | 16.781 | 22.85% | 26.61% |
| 2017-05-23 | XBKS | SQZ | y | 28.35 | 30 | 83 | 31.1 | 9.7% | 10.23% |
| 2017-05-25 | GTT | CWH | n | 30.50 | 32 | 86 | 31.5 | 3.28% | 4.43% |
| 2017-05-25 | SQM | SQZ | y | 36.27 | 37 | 92 | 37.31 | 2.87% | 3.31% |
| 2017-05-24 | CCUR | CWH | n | 6.49 | 7 | 85 | 6.66 | 2.62% | 5.24% |
| 2017-05-26 | QADA | CWH | n | 31.40 | 32 | 86 | 32 | 1.91% | 2.39% |
| 2017-05-23 | LFC | CWH | n | 16.09 | 16 | 82 | 16.32 | 1.43% | 2.61% |
| 2017-05-24 | HDP | CWH | n | 13.76 | 14 | 88 | 13.69 | -0.51% | 0.94% |
| 2017-05-25 | ANGI | HTF | n | 11.96 | 12 | 97 | 11.855 | -0.88% | 0.21% |
| *RS Rank on day before breakout. | |||||||||
| Symbol | BO Price |
BO Vol. |
Company | Industry | RS Rank |
Last Close |
|---|---|---|---|---|---|---|
| EMKR | 10.95 | 535,436 | EMCORE Corporation | Semiconductor - Integrated Circuits | 96 | 10.28 |
| FRBK | 9.38 | 420,705 | Republic First Bancorp - Inc. | Regional - Northeast Banks | 96 | 9.00 |
| MRCY | 41.49 | 680,706 | Mercury Systems Inc | Computer Peripherals | 93 | 40.35 |
| LMIA | 14.00 | 87,501 | LMI Aerospace - Inc. | Aerospace/Defense Products & Services | 93 | 13.95 |
| BITA | 32.58 | 1,257,196 | Bitauto Holdings Limited | Internet Information Providers | 92 | 29.20 |
| These stocks meet our suggested screening factors
for our Cup and Handle Chart Pattern watchlist. See Revised Rules for Trading Cup and Handle Breakouts |
||||||
| Index | Value | Change Week | Change YTD | Trend1 |
|---|---|---|---|---|
| Dow | 21080.3 |
1.32% | 6.67% | Up |
| NASDAQ | 6210.19 |
2.08% | 15.36% | Up |
| S&P 500 | 2415.82 |
1.43% | 7.91% | Up |
|
1The Market Trend is derived from
our proprietary market model. The market model is described on
the sitehere.
2The site also shows industry rankings based on fundamentals, combined technical and fundamentals, and on price alone. The site also shows daily industry movements. |
||||
| 1 Week | 13 Weeks | 26 Weeks | Year-to-Date |
|---|---|---|---|
| NASDAQ Composite |
NASDAQ Composite 6.24 % |
NASDAQ Composite 15.03 % |
NASDAQ Composite 15.36 % |
| 1 Week | 3 Weeks | 13 Weeks | 26 Weeks |
|---|---|---|---|
| Consumer Services |
Consumer Services |
Consumer Services |
Consumer Services |
| Aerospace/Defense - Major Diversified 73 |
Healthcare Information Services 63 |
Computers Wholesale 197 |
Multimedia & Graphics Software 139 |
| Charts of each industry rank and performance over 12 months are available on the site | |||
If you received this newsletter from a friend and you would like to receive it regularly please go to the BreakoutWatch.com site and you will then be able to register to receive the newsletter.
Copyright (c) 05/27/2017 NBIcharts, LLC dba BreakoutWatch.com. All
rights reserved.
" BreakoutWatch," the BreakoutWatch.com "eye" logo, and the slogan
"tomorrow's breakouts today" are service marks of NBIcharts LLC. All
other marks are the property of their respective owners, and are used
for descriptive purposes only.
BreakoutWatch is not affiliated with Investor's Business Daily or with Mr. William O'Neil. Our site, research and analysis is supported entirely by subscription and is free from advertising.