Breakoutwatch Weekly Summary 08/12/17
You are receiving this email because you are or were a BreakoutWatch.com subscriber, or have subscribed to our weekly newsletter. This newsletter summarizes the breakout events of the week and provides additional guidance that does not fit into our daily format. It is published each weekend.
| Our market trend indicators remain
positive despite the three major indexes losing over 1% as traders
took profits in response to heightened tension with North Korea.
The NASDAQ Composite was the biggest loser as it gave up 1.5%.
Friday brought some relief as threats and counter threats
continued but volume was well below the 50 day average. Inflation remains low which implies that investors need not fear a fed funds rate hike in the near future. "The fed funds futures market now points to the June FOMC meeting as the most likely time for the next rate-hike announcement with an implied probability of 57.5%. Last week, the market expected the next rate hike to occur in December with an implied probability of 50.4%." (briefing.com) The negative sentiment kept confirmed breakouts to just 10 with the cup and handle pattern again providing the bulk of the successes with 8 breakouts and 2 from the Volatility squeeze pattern. 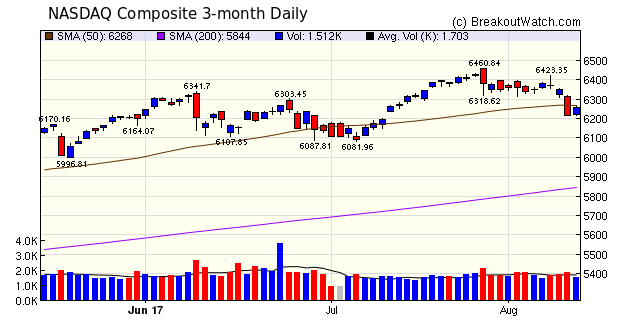 |
| No new features this week |
|
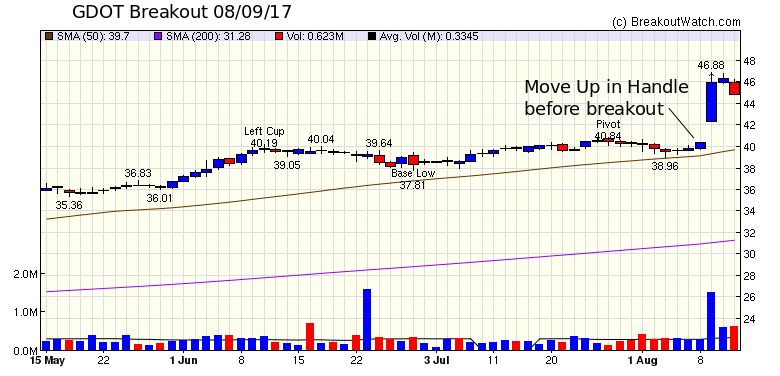
Our latest strategy suggestions are here. The breakout of GDOT (gain of
15% on breakout) is a further example of the tip I gave last
week, which is that strong gains in the handle can portend
strong breakouts. Also important, was that the RS Rank was
97, well above our strategy suggestion that the most
important factor in strong breakouts is an RS Rank of 94 or
above. If you apply our recommended filters for cup and
handle stocks and examine the charts carefully you can
easily spots potential breakouts such as these.
 |
| List | Breakouts | Avg. Gain |
|---|---|---|
| CWH | 8 | 2.83 |
| SQZ | 2 | -1.62 |
| HTF | 0 | |
| HSB | 0 | |
| DB | 0 |
| Brkout Date | Symbol | Base | Squeeze | BrkoutOut Price | Brkout Day Close | RS Rank* | Last Close | Current % off BOP | Gain at Intraday High |
|---|---|---|---|---|---|---|---|---|---|
| 2017-08-08 | ASYS | CWH | n | 9.45 | 9 | 96 | 10.5 | 11.11% | 11.11% |
| 2017-08-09 | ERI | CWH | n | 21.05 | 22 | 90 | 23.325 | 10.81% | 11.16% |
| 2017-08-09 | GDOT | CWH | y | 40.84 | 46 | 95 | 44.88 | 9.89% | 14.79% |
| 2017-08-07 | ETSY | CWH | n | 15.27 | 15 | 89 | 16.21 | 6.16% | 6.22% |
| 2017-08-11 | EPAY | CWH | n | 29.00 | 30 | 80 | 29.98 | 3.38% | 3.45% |
| 2017-08-10 | MITT | SQZ | y | 19.35 | 19 | 81 | 19.34 | -0.05% | 1.09% |
| 2017-08-07 | BYD | CWH | n | 26.24 | 27 | 87 | 26.18 | -0.23% | 1.75% |
| 2017-08-08 | KLXI | SQZ | y | 52.18 | 53 | 89 | 50.52 | -3.18% | 4.25% |
| 2017-08-07 | ALDW | CWH | n | 12.27 | 12 | 94 | 11.14 | -9.21% | 0.16% |
| 2017-08-07 | GAIA | CWH | n | 12.45 | 13 | 90 | 11.3 | -9.24% | 8.43% |
| *RS Rank on day before breakout. | |||||||||
| |
| Symbol | BO Price |
BO Vol. |
Company | Industry | RS Rank |
Last Close |
|---|---|---|---|---|---|---|
| IRBT | 109.78 | 1,643,440 | iRobot Corporation | Appliances | 97 | 102.23 |
| BEAT | 35.40 | 596,164 | BioTelemetry | Medical Laboratories & Research | 96 | 34.53 |
| LRCX | 170.00 | 3,905,078 | Lam Research Corporation | Semiconductor Equipment & Materials | 94 | 154.26 |
| HOFT | 44.40 | 114,032 | Hooker Furniture Corporation | Home Furnishings & Fixtures | 93 | 42.35 |
| AEL | 28.07 | 661,869 | American Equity Investment Life Holding Company | Life Insurance | 92 | 27.74 |
| BLDR | 16.75 | 997,624 | Builders FirstSource | General Building Materials | 92 | 16.33 |
| These stocks meet our suggested screening factors
for our Cup and Handle Chart Pattern watchlist. See Revised Rules for Trading Cup and Handle Breakouts |
||||||
| Index | Value | Change Week | Change YTD | Trend1 |
|---|---|---|---|---|
| Dow | 21858.3 |
-1.06% | 10.6% | Up |
| NASDAQ | 6256.56 |
-1.5% | 16.23% | Up |
| S&P 500 | 2441.32 |
-1.43% | 9.04% | Up |
|
1The Market Trend is derived from
our proprietary market model. The market model is described on
the sitehere.
2The site also shows industry rankings based on fundamentals, combined technical and fundamentals, and on price alone. The site also shows daily industry movements. |
||||
| 1 Week | 13 Weeks | 26 Weeks | Year-to-Date |
|---|---|---|---|
| Dow Jones |
Dow Jones 2.21 % |
NASDAQ Composite 9.11 % |
NASDAQ Composite 16.23 % |
| 1 Week | 3 Weeks | 13 Weeks | 26 Weeks |
|---|---|---|---|
| Appliances |
Aluminum |
Appliances |
Consumer Services |
| Processing Systems & Products 148 |
Computer Based Systems 168 |
Publishing - Books 163 |
Publishing - Books 206 |
| Charts of each industry rank and performance over 12 months are available on the site | |||
If you received this newsletter from a friend and you would like to receive it regularly please go to the BreakoutWatch.com site and you will then be able to register to receive the newsletter.
Copyright (c) 08/12/2017 NBIcharts, LLC dba BreakoutWatch.com. All
rights reserved.
" BreakoutWatch," the BreakoutWatch.com "eye" logo, and the slogan
"tomorrow's breakouts today" are service marks of NBIcharts LLC. All
other marks are the property of their respective owners, and are used
for descriptive purposes only.
BreakoutWatch is not affiliated with Investor's Business Daily or with Mr. William O'Neil. Our site, research and analysis is supported entirely by subscription and is free from advertising.