Breakoutwatch Weekly Summary 01/27/18
You are receiving this email because you are or were a BreakoutWatch.com subscriber, or have subscribed to our weekly newsletter. This newsletter summarizes the breakout events of the week and provides additional guidance that does not fit into our daily format. It is published each weekend.
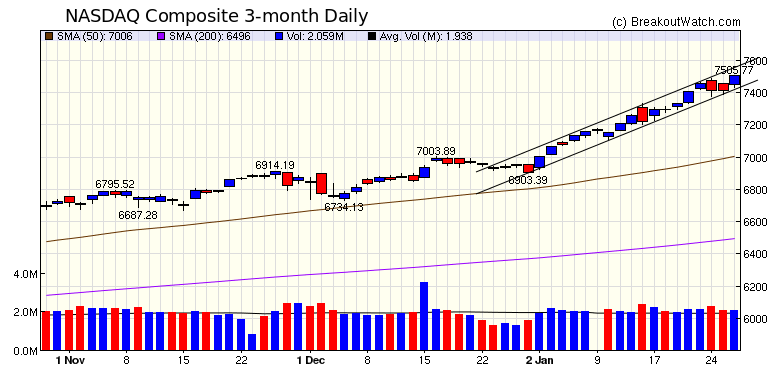 The major indexes continue their
strong advance with all three closing at new highs on Friday.
The NASDAQ Composite outperformed the others with a gain of
2.26% for the week. Friday's move higher came despite the
release of the preliminary GDP forecast for the 4th quarter
which was below expectations of 2.9% at 2.6% annualized. However
investors focused on strong consumer spending which rose 3.8%
and business equipment spending which rose 11.4%.
|
| I've added an indicator to the daily market analysis page and daily email which shows which, if any, breakouts which meet our "Buy at Open" strategy requirements. For example, here's an excerpt from Friday's Market Analysis page: 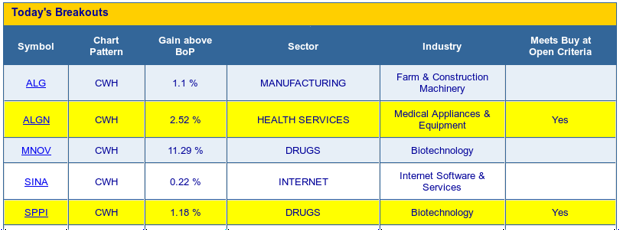 |
|
Our latest strategy
suggestions are here.
|
| List | Breakouts | Avg. Gain |
|---|---|---|
| CWH | 29 | 4.51 |
| SQZ | 45 | 1.88 |
| HTF | 0 | |
| HSB | 0 | |
| DB | 1 | 4.73 |
| Brkout Date | Symbol | Base | Squeeze | BrkoutOut Price | Brkout Day Close | RS Rank* | Last Close | Current % off BOP | Gain at Intraday High |
|---|---|---|---|---|---|---|---|---|---|
| 2018-01-23 | WRLD | CWH | n | 88.54 | 95.35 | 82 | 117.31 | 32.49% | 34.66% |
| 2018-01-25 | MDXG | CWH | n | 15.33 | 15.71 | 88 | 17.21 | 12.26% | 15.46% |
| 2018-01-26 | MNOV | CWH | n | 7.88 | 8.77 | 82 | 8.77 | 11.29% | 14.21% |
| 2018-01-24 | JNP | CWH | n | 6.40 | 6.55 | 87 | 7.1 | 10.94% | 11.41% |
| 2018-01-23 | SPPI | SQZ | y | 20.93 | 21.63 | 98 | 23.07 | 10.22% | 11.32% |
| 2018-01-22 | CTLT | CWH | n | 43.42 | 43.7 | 81 | 47.36 | 9.07% | 9.3% |
| 2018-01-22 | VAC | SQZ | y | 139.31 | 140.75 | 83 | 151.85 | 9% | 9.09% |
| 2018-01-23 | VAC | SQZ | y | 140.76 | 144.42 | 83 | 151.85 | 7.88% | 7.96% |
| 2018-01-22 | INAP | SQZ | y | 15.59 | 15.72 | 95 | 16.62 | 6.61% | 6.74% |
| 2018-01-24 | BABA | CWH | n | 192.49 | 195.54 | 89 | 205.22 | 6.61% | 6.62% |
| 2018-01-22 | AGIO | CWH | n | 76.02 | 78.35 | 81 | 80.7 | 6.16% | 9.13% |
| 2018-01-22 | VRTX | CWH | n | 159.87 | 161.91 | 81 | 169.21 | 5.84% | 5.9% |
| 2018-01-22 | AMN | CWH | y | 50.80 | 51 | 81 | 53.65 | 5.61% | 5.91% |
| 2018-01-23 | FIVN | DB | n | 25.14 | 25.64 | 72 | 26.33 | 4.73% | 4.97% |
| 2018-01-25 | AMN | SQZ | y | 51.26 | 52.45 | 81 | 53.65 | 4.66% | 4.96% |
| 2018-01-23 | DRNA | CWH | y | 9.83 | 10.94 | 98 | 10.28 | 4.58% | 13.84% |
| 2018-01-23 | INGN | SQZ | y | 120.34 | 120.65 | 90 | 125.75 | 4.5% | 5.03% |
| 2018-01-26 | INAP | SQZ | y | 15.98 | 16.62 | 82 | 16.62 | 4.01% | 4.13% |
| 2018-01-26 | PTLA | SQZ | y | 52.14 | 54.23 | 80 | 54.23 | 4.01% | 5.39% |
| 2018-01-22 | SBAC | SQZ | y | 165.80 | 167.65 | 80 | 172.28 | 3.91% | 4.12% |
| 2018-01-22 | WPX | CWH | n | 15.17 | 15.37 | 83 | 15.76 | 3.89% | 6.06% |
| 2018-01-26 | NEWR | SQZ | y | 59.67 | 61.94 | 86 | 61.94 | 3.8% | 4.16% |
| 2018-01-22 | ARES | CWH | n | 23.80 | 24.2 | 81 | 24.7 | 3.78% | 6.05% |
| 2018-01-22 | WIFI | SQZ | y | 22.89 | 23.04 | 89 | 23.71 | 3.58% | 4.63% |
| 2018-01-22 | TGH | CWH | n | 24.95 | 25.85 | 95 | 25.75 | 3.21% | 6.21% |
| 2018-01-22 | CALD | SQZ | y | 30.86 | 31 | 88 | 31.85 | 3.21% | 3.37% |
| 2018-01-26 | QNST | SQZ | y | 9.30 | 9.57 | 96 | 9.57 | 2.9% | 4.52% |
| 2018-01-23 | BLUE | SQZ | y | 194.66 | 200.2 | 97 | 200.25 | 2.87% | 8.29% |
| 2018-01-23 | WIFI | SQZ | y | 23.05 | 23.31 | 89 | 23.71 | 2.86% | 3.9% |
| 2018-01-26 | CYRX | SQZ | y | 8.63 | 8.87 | 96 | 8.87 | 2.78% | 6.95% |
| 2018-01-26 | ALDX | SQZ | y | 7.26 | 7.45 | 87 | 7.45 | 2.62% | 3.99% |
| 2018-01-24 | NAV | SQZ | y | 46.24 | 46.71 | 91 | 47.45 | 2.62% | 2.72% |
| 2018-01-24 | TDC | SQZ | y | 39.84 | 39.9 | 83 | 40.86 | 2.56% | 2.59% |
| 2018-01-26 | ALGN | CWH | n | 276.99 | 283.97 | 96 | 283.97 | 2.52% | 3.73% |
| 2018-01-23 | X | CWH | n | 39.96 | 40.06 | 88 | 40.95 | 2.48% | 3.3% |
| 2018-01-24 | KAI | SQZ | y | 99.16 | 100.05 | 83 | 101.5 | 2.36% | 3.32% |
| 2018-01-22 | KFY | SQZ | y | 43.22 | 43.57 | 80 | 44.21 | 2.29% | 2.29% |
| 2018-01-24 | CI | CWH | n | 221.23 | 221.46 | 82 | 226.22 | 2.26% | 2.28% |
| 2018-01-22 | APAM | CWH | y | 40.45 | 40.9 | 84 | 41.35 | 2.22% | 2.35% |
| 2018-01-22 | GDOT | SQZ | y | 62.48 | 62.54 | 94 | 63.66 | 1.89% | 3.1% |
| 2018-01-22 | UNT | CWH | n | 25.80 | 26.3 | 80 | 26.26 | 1.78% | 3.95% |
| 2018-01-26 | INGN | SQZ | y | 123.90 | 125.75 | 91 | 125.75 | 1.49% | 2.01% |
| 2018-01-25 | RUSHA | CWH | n | 54.37 | 54.81 | 86 | 55.16 | 1.45% | 1.89% |
| 2018-01-25 | KAI | SQZ | y | 100.06 | 101.6 | 84 | 101.5 | 1.44% | 2.39% |
| 2018-01-22 | RDNT | SQZ | y | 10.16 | 10.2 | 84 | 10.3 | 1.38% | 2.85% |
| 2018-01-26 | EVC | SQZ | y | 7.31 | 7.4 | 83 | 7.4 | 1.23% | 1.92% |
| 2018-01-26 | SPPI | CWH | n | 22.80 | 23.07 | 98 | 23.07 | 1.18% | 2.19% |
| 2018-01-25 | SXCP | CWH | n | 21.45 | 21.6 | 81 | 21.7 | 1.17% | 2.33% |
| 2018-01-26 | ALG | CWH | n | 118.82 | 120.13 | 82 | 120.13 | 1.1% | 1.49% |
| 2018-01-26 | LBC | SQZ | y | 12.78 | 12.92 | 99 | 12.92 | 1.1% | 2.97% |
| 2018-01-24 | NTP | SQZ | y | 13.16 | 13.2 | 90 | 13.3 | 1.06% | 1.82% |
| 2018-01-22 | COT | SQZ | y | 17.05 | 17.25 | 82 | 17.2 | 0.88% | 1.7% |
| 2018-01-22 | GOGL | CWH | n | 9.29 | 9.35 | 80 | 9.34 | 0.54% | 1.08% |
| 2018-01-22 | IMGN | CWH | n | 8.33 | 8.55 | 96 | 8.37 | 0.48% | 4.08% |
| 2018-01-26 | TACT | CWH | n | 15.50 | 15.55 | 95 | 15.55 | 0.32% | 0.97% |
| 2018-01-25 | ALNY | SQZ | y | 134.06 | 134.29 | 97 | 134.39 | 0.25% | 1.66% |
| 2018-01-26 | COT | SQZ | y | 17.16 | 17.2 | 80 | 17.2 | 0.23% | 0.99% |
| 2018-01-26 | SINA | CWH | n | 121.92 | 122.19 | 86 | 122.19 | 0.22% | 0.83% |
| 2018-01-26 | FRPT | SQZ | y | 18.81 | 18.85 | 86 | 18.85 | 0.21% | 0.48% |
| 2018-01-26 | TILE | CWH | y | 26.10 | 26.15 | 83 | 26.15 | 0.19% | 0.57% |
| 2018-01-24 | MCRI | SQZ | y | 44.96 | 44.98 | 90 | 45.02 | 0.13% | 2.54% |
| 2018-01-25 | BPMC | SQZ | y | 82.93 | 83.44 | 94 | 83.01 | 0.1% | 3.16% |
| 2018-01-22 | CVTI | SQZ | y | 28.87 | 28.91 | 88 | 28.82 | -0.17% | 2.22% |
| 2018-01-22 | PHM | SQZ | y | 34.61 | 35.15 | 90 | 34.52 | -0.26% | 1.73% |
| 2018-01-23 | PRI | SQZ | y | 105.96 | 106.45 | 84 | 105.6 | -0.34% | 1.97% |
| 2018-01-22 | ERI | SQZ | y | 32.96 | 33.6 | 94 | 32.82 | -0.42% | 6.64% |
| 2018-01-22 | KMPR | SQZ | y | 69.21 | 69.35 | 91 | 68.9 | -0.45% | 1.94% |
| 2018-01-23 | PCYO | SQZ | y | 8.76 | 8.9 | 84 | 8.7 | -0.68% | 2.17% |
| 2018-01-22 | MRO | CWH | n | 19.04 | 19.28 | 84 | 18.84 | -1.05% | 2.52% |
| 2018-01-23 | HY | SQZ | y | 88.95 | 89.5 | 82 | 87.86 | -1.23% | 2.74% |
| 2018-01-24 | CWH | SQZ | y | 45.85 | 46.86 | 84 | 45.2 | -1.42% | 2.7% |
| 2018-01-23 | FOLD | CWH | n | 16.48 | 17.12 | 95 | 16.2 | -1.7% | 5.58% |
| 2018-01-23 | ERI | SQZ | y | 33.61 | 34 | 94 | 32.82 | -2.35% | 4.58% |
| 2018-01-23 | MOV | SQZ | y | 33.51 | 33.7 | 82 | 32.35 | -3.46% | 1.01% |
| 2018-01-23 | CONN | SQZ | y | 37.06 | 37.2 | 97 | 35.12 | -5.23% | 1.73% |
| *RS Rank on day before breakout. | |||||||||
| Symbol | BO Price |
BO Vol. |
Company | Industry | RS Rank |
Last Close |
|---|---|---|---|---|---|---|
| NC | 45.90 | 62,118 | NACCO Industries - Inc. Common Stock | Home Furnishings & Fixtures | 96 | 44.05 |
| CONN | 37.70 | 748,918 | Electronics Stores | 95 | 35.12 | |
| SGMS | 56.45 | 1,210,323 | Scientific Games Corp - Common Stock | Gaming Activities | 95 | 51.60 |
| PNK | 33.63 | 1,154,193 | Pinnacle Entertainment - Inc. - Common Stock | Resorts & Casinos | 94 | 33.38 |
| These stocks meet our suggested screening factors
for our Cup and Handle Chart Pattern watchlist. See Revised Rules for Trading Cup and Handle Breakouts |
||||||
| Index | Value | Change Week | Change YTD | Trend1 |
|---|---|---|---|---|
| Dow | 26393 |
2.05% | 6.77% | Up |
| NASDAQ | 7411 |
2.26% | 7.35% | Up |
| S&P 500 | 2869.11 |
2.18% | 7.31% | Up |
|
1The Market Trend is derived from
our proprietary market model. The market model is described on
the site here.
2The site also shows industry rankings based on fundamentals, combined technical and fundamentals, and on price alone. The site also shows daily industry movements. |
||||
| 1 Week | 13 Weeks | 26 Weeks | Year-to-Date |
|---|---|---|---|
| S&P 500 |
Dow Jones 12.63 % |
Dow Jones 20.9 % |
NASDAQ Composite 7.35 % |
| 1 Week | 3 Weeks | 13 Weeks | 26 Weeks |
|---|---|---|---|
| Auto Parts Wholesale |
Auto Parts Wholesale |
Auto Parts Wholesale |
Resorts & Casinos |
| Appliances 82 |
Basic Materials Wholesale 109 |
Auto Parts Stores 180 |
Personal Computers 216 |
| Charts of each industry rank and performance over 12 months are available on the site | |||
If you received this newsletter from a friend and you would like to receive it regularly please go to the BreakoutWatch.com site and you will then be able to register to receive the newsletter.
Copyright (c) 01/27/2018 NBIcharts, LLC dba BreakoutWatch.com. All
rights reserved.
" BreakoutWatch," the BreakoutWatch.com "eye" logo, and the slogan
"tomorrow's breakouts today" are service marks of NBIcharts LLC. All
other marks are the property of their respective owners, and are used
for descriptive purposes only.
BreakoutWatch is not affiliated with Investor's Business Daily or with Mr. William O'Neil. Our site, research and analysis is supported entirely by subscription and is free from advertising.