Breakoutwatch Weekly Summary 04/14/18
You are receiving this email because you are or were a BreakoutWatch.com subscriber, or have subscribed to our weekly newsletter. This newsletter summarizes the breakout events of the week and provides additional guidance that does not fit into our daily format. It is published each weekend.
| Volume Required for Confirmed
Breakout Revised to 150% of 50 day Average The NASDAQ Composite enjoyed a positive week with a gain of 2.8%, comfortably beating gains of 1.8% and 2% by the DJI and S&P 500 respectively. Fears of a trade war were somewhat alleviated which allowed a recovery early in the week, but angst over a potential, now confirmed, strike against Syria complicated assessments of the market's direction. Volumes declined, as the chart below shows, indicating there is a lack of conviction that the rally will hold. The NASDAQ looked ready to test resistance at the 50 day moving average level, but Friday's sell-off as a strike appeared imminent, has delayed that test for now. Our trend indicators for all three major indicators remain negative. 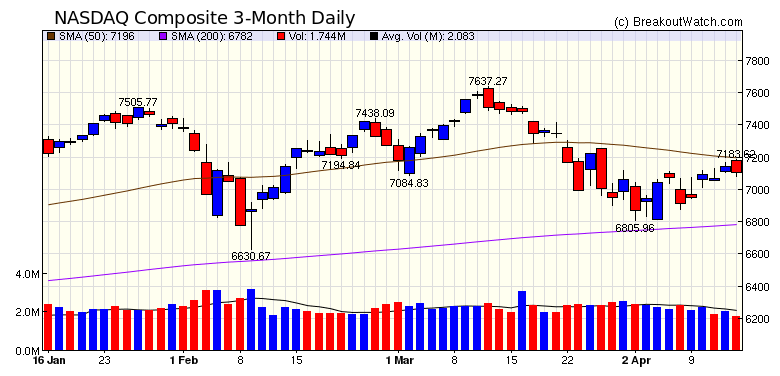 A 12 month chart of the NASDAQ (below) shows how dramatically volatility has increased since January. I've over-layed the chart with a Bollinger Band study (BB), which is a measure of volatility, to illustrate this. Note that through to December, the BB was in a narrow range which started to widen at the beginning of the year as the price gradient increased. In retrospect, it's clear that prices were overheated and a correction was due. At the end of December the BB range was 300 points, but now it has more than doubled to 650 points. At the beginning of the year, I chose to lower the volume requirement for a confirmed breakout to 100% of the 50-day average volume because of the low volatility during 2017. Now that volatility is so much higher, and it looks as though that will continue, I am raising the volume requirement for a confirmed breakout back to 150% of the 50 day volume. This will take effect from Monday, April 16. This will apply to all watchlists except the High Tight Flag, where the volume requirement will stay at 100% of 50-day average volume. 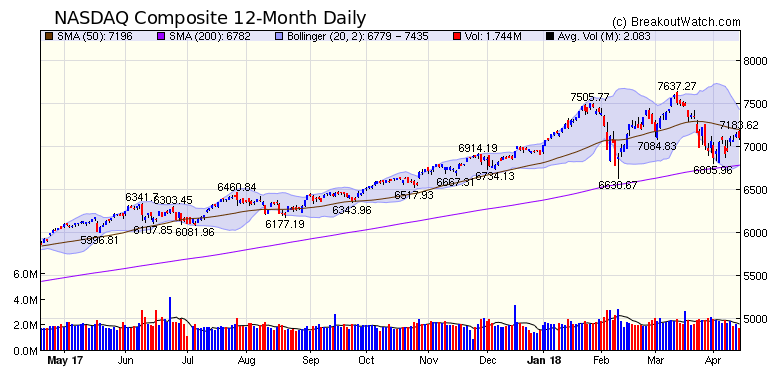 |
| No new features this week. |
|
Our latest strategy
suggestions are here.
If you are overwhelmed with volume of alerts being received, please see the newsletter article Using Filters to Ensure only Targeted Alerts |
| List | Breakouts | Avg. Gain |
|---|---|---|
| CWH | 42 | 1.27 |
| SQZ | 68 | 1.01 |
| HTF | 0 | |
| HSB | 0 | |
| DB | 15 | 2.46 |
| Brkout Date | Symbol | Base | Squeeze | BrkoutOut Price | Brkout Day Close | RS Rank* | Last Close | Current % off BOP | Gain at Intraday High |
|---|---|---|---|---|---|---|---|---|---|
| 2018-04-09 | AA | DB | n | 48.99 | 50.62 | 80 | 54.96 | 12.19% | 10.78% |
| 2018-04-10 | VNOM | CWH | n | 25.65 | 26 | 92 | 28.15 | 9.75% | 3.66% |
| 2018-04-10 | ONCE | SQZ | y | 70.37 | 75.95 | 87 | 77.04 | 9.48% | 8.9% |
| 2018-04-11 | BRS | SQZ | y | 14.05 | 14.53 | 88 | 15.2 | 8.19% | 5.12% |
| 2018-04-11 | HP | DB | y | 68.35 | 71.51 | 81 | 73.05 | 6.88% | 6.03% |
| 2018-04-09 | ATHM | CWH | n | 88.51 | 89.34 | 97 | 94.51 | 6.78% | 7.13% |
| 2018-04-10 | BOOM | CWH | n | 27.25 | 27.6 | 96 | 29.05 | 6.61% | 3.67% |
| 2018-04-10 | SMTC | CWH | n | 41.00 | 42.8 | 80 | 43.25 | 5.49% | 6.34% |
| 2018-04-11 | RSPP | CWH | n | 44.97 | 45.68 | 82 | 47.15 | 4.85% | 1.38% |
| 2018-04-10 | MNTA | SQZ | y | 18.56 | 18.85 | 91 | 19.45 | 4.8% | 4.96% |
| 2018-04-10 | FIVE | CWH | n | 71.81 | 74.09 | 91 | 75.24 | 4.78% | 4.44% |
| 2018-04-10 | CLR | CWH | n | 59.09 | 60.99 | 93 | 61.86 | 4.69% | 3.88% |
| 2018-04-11 | CEO | DB | n | 150.79 | 155.89 | 82 | 157.7 | 4.58% | 4.74% |
| 2018-04-12 | BRS | SQZ | y | 14.54 | 14.8 | 90 | 15.2 | 4.54% | 1.58% |
| 2018-04-10 | HTZ | CWH | n | 20.64 | 21.05 | 81 | 21.5 | 4.17% | 2.96% |
| 2018-04-13 | SPNE | DB | n | 11.63 | 12.05 | 82 | 12.05 | 3.61% | 1.72% |
| 2018-04-12 | SPNE | DB | n | 11.63 | 11.84 | 81 | 12.05 | 3.61% | 1.72% |
| 2018-04-11 | CAMT | SQZ | y | 7.14 | 7.19 | 92 | 7.39 | 3.5% | 1.54% |
| 2018-04-09 | TOWR | DB | n | 28.55 | 29.05 | 72 | 29.5 | 3.33% | 3.33% |
| 2018-04-12 | SPRO | SQZ | y | 15.00 | 17.85 | 86 | 15.49 | 3.27% | 1.27% |
| 2018-04-10 | TVPT | CWH | n | 16.20 | 16.35 | 87 | 16.72 | 3.21% | 1.85% |
| 2018-04-12 | CALM | CWH | n | 46.65 | 46.7 | 80 | 48 | 2.89% | -0.41% |
| 2018-04-11 | ERJ | SQZ | y | 26.18 | 27.49 | 82 | 26.92 | 2.83% | 3.25% |
| 2018-04-12 | CAMT | SQZ | y | 7.20 | 7.29 | 92 | 7.39 | 2.64% | 0.69% |
| 2018-04-12 | ENTA | SQZ | y | 83.79 | 84.74 | 98 | 85.98 | 2.61% | 0.19% |
| 2018-04-10 | MPC | CWH | n | 72.73 | 73.7 | 88 | 74.59 | 2.56% | 1.7% |
| 2018-04-11 | AEG | SQZ | y | 7.03 | 7.08 | 87 | 7.2 | 2.42% | 2.28% |
| 2018-04-11 | IO | SQZ | y | 26.96 | 27.55 | 99 | 27.6 | 2.37% | 2.19% |
| 2018-04-12 | EDN | SQZ | y | 57.38 | 58.5 | 93 | 58.7 | 2.3% | -1.03% |
| 2018-04-10 | PVH | CWH | n | 155.61 | 157.95 | 90 | 159.13 | 2.26% | 2.18% |
| 2018-04-13 | SGY | CWH | n | 37.22 | 38.04 | 92 | 38.04 | 2.2% | -0.4% |
| 2018-04-11 | RHP | SQZ | y | 76.43 | 77.4 | 82 | 78.09 | 2.17% | 1.3% |
| 2018-04-11 | HTZ | SQZ | y | 21.06 | 21.07 | 80 | 21.5 | 2.09% | 0.9% |
| 2018-04-11 | TDY | SQZ | y | 189.58 | 190.25 | 86 | 193.46 | 2.05% | 1.13% |
| 2018-04-10 | BSAC | CWH | n | 34.06 | 34.15 | 84 | 34.75 | 2.03% | 1.59% |
| 2018-04-12 | RXN | SQZ | y | 29.68 | 30.18 | 83 | 30.28 | 2.02% | 1.68% |
| 2018-04-11 | APC | SQZ | y | 61.82 | 63.2 | 83 | 63.03 | 1.96% | 1.41% |
| 2018-04-11 | ATR | DB | n | 91.14 | 92.25 | 74 | 92.75 | 1.77% | 1.46% |
| 2018-04-12 | TDY | SQZ | y | 190.26 | 194.14 | 86 | 193.46 | 1.68% | 0.77% |
| 2018-04-12 | BCOR | SQZ | y | 24.26 | 24.75 | 80 | 24.65 | 1.61% | 0.37% |
| 2018-04-10 | KLXI | SQZ | y | 71.23 | 71.73 | 89 | 72.35 | 1.57% | 1.6% |
| 2018-04-12 | UFI | SQZ | y | 37.40 | 38.1 | 80 | 37.97 | 1.52% | -0.21% |
| 2018-04-12 | ALG | SQZ | y | 112.81 | 113.46 | 81 | 114.51 | 1.51% | -0.04% |
| 2018-04-12 | INXN | SQZ | y | 62.18 | 63.01 | 88 | 63.07 | 1.43% | 0.24% |
| 2018-04-10 | AMED | CWH | n | 64.18 | 64.55 | 87 | 65.08 | 1.4% | 1.06% |
| 2018-04-12 | CPLA | CWH | n | 90.30 | 90.6 | 80 | 91.55 | 1.38% | 0.11% |
| 2018-04-12 | RIO | DB | y | 53.57 | 53.81 | 75 | 54.26 | 1.29% | 1.03% |
| 2018-04-13 | RIO | DB | n | 53.57 | 54.26 | 78 | 54.26 | 1.29% | 1.03% |
| 2018-04-11 | CRMT | SQZ | y | 49.81 | 50.55 | 86 | 50.4 | 1.18% | 0.38% |
| 2018-04-11 | TTOO | CWH | y | 6.84 | 7.13 | 95 | 6.92 | 1.17% | 3.07% |
| 2018-04-10 | DPS | SQZ | y | 119.51 | 120.34 | 91 | 120.81 | 1.09% | 0.69% |
| 2018-04-10 | MBI | CWH | n | 9.26 | 9.39 | 81 | 9.36 | 1.08% | 4.54% |
| 2018-04-12 | USG | CWH | n | 40.34 | 40.77 | 84 | 40.77 | 1.07% | 0.64% |
| 2018-04-11 | EZPW | SQZ | y | 13.26 | 13.55 | 92 | 13.4 | 1.06% | 1.06% |
| 2018-04-11 | EXPO | SQZ | y | 80.11 | 80.65 | 86 | 80.9 | 0.99% | 0.49% |
| 2018-04-11 | KRA | SQZ | y | 50.10 | 50.12 | 87 | 50.58 | 0.96% | -0.5% |
| 2018-04-12 | RHP | SQZ | y | 77.41 | 78.13 | 83 | 78.09 | 0.88% | 0.01% |
| 2018-04-13 | UBNT | SQZ | y | 71.20 | 71.78 | 85 | 71.78 | 0.81% | -1.46% |
| 2018-04-11 | HEI | SQZ | y | 87.16 | 87.24 | 90 | 87.86 | 0.8% | 0.2% |
| 2018-04-13 | FOXA | SQZ | y | 36.50 | 36.79 | 83 | 36.79 | 0.79% | 0.27% |
| 2018-04-13 | EOG | DB | n | 110.16 | 111.02 | 71 | 111.02 | 0.78% | -0.5% |
| 2018-04-12 | CW | SQZ | y | 136.49 | 137.51 | 89 | 137.56 | 0.78% | 0.11% |
| 2018-04-13 | BREW | CWH | n | 19.65 | 19.8 | 80 | 19.8 | 0.76% | -0.51% |
| 2018-04-13 | RCKY | SQZ | y | 21.36 | 21.5 | 94 | 21.5 | 0.66% | -1.45% |
| 2018-04-11 | ENVA | SQZ | y | 22.51 | 22.8 | 95 | 22.65 | 0.62% | 1.07% |
| 2018-04-12 | TDG | CWH | y | 307.44 | 308.19 | 84 | 309.22 | 0.58% | -0.13% |
| 2018-04-12 | TILE | SQZ | y | 25.16 | 25.2 | 82 | 25.3 | 0.56% | -0.44% |
| 2018-04-13 | BLFS | CWH | n | 7.19 | 7.23 | 98 | 7.23 | 0.56% | -0.56% |
| 2018-04-11 | RDWR | SQZ | y | 22.03 | 22.22 | 86 | 22.15 | 0.54% | 0.64% |
| 2018-04-10 | WK | CWH | n | 24.27 | 24.4 | 87 | 24.4 | 0.54% | 0.54% |
| 2018-04-10 | FONR | CWH | n | 28.85 | 29.6 | 84 | 29 | 0.52% | 0.38% |
| 2018-04-13 | BL | SQZ | y | 40.06 | 40.24 | 82 | 40.24 | 0.45% | -0.95% |
| 2018-04-10 | FE | CWH | n | 34.26 | 34.39 | 81 | 34.41 | 0.44% | -0.2% |
| 2018-04-11 | IPCC | SQZ | y | 118.71 | 119.15 | 86 | 119.2 | 0.41% | 0.37% |
| 2018-04-10 | YUM | CWH | n | 85.09 | 85.58 | 80 | 85.42 | 0.39% | 0.66% |
| 2018-04-11 | DPS | SQZ | y | 120.35 | 120.53 | 90 | 120.81 | 0.38% | -0.01% |
| 2018-04-13 | RMD | SQZ | y | 98.51 | 98.85 | 88 | 98.85 | 0.35% | -0.11% |
| 2018-04-12 | KLXI | SQZ | y | 72.11 | 72.76 | 89 | 72.35 | 0.33% | 0.36% |
| 2018-04-11 | FLIR | SQZ | y | 51.21 | 51.27 | 87 | 51.37 | 0.31% | 0.41% |
| 2018-04-12 | EXPO | SQZ | y | 80.66 | 80.9 | 86 | 80.9 | 0.3% | -0.2% |
| 2018-04-12 | XRM | CWH | n | 6.56 | 6.57 | 82 | 6.58 | 0.3% | -2.29% |
| 2018-04-11 | WING | SQZ | y | 48.16 | 48.3 | 93 | 48.28 | 0.25% | 0.1% |
| 2018-04-12 | FLIR | SQZ | y | 51.28 | 51.52 | 86 | 51.37 | 0.18% | 0.27% |
| 2018-04-13 | CNC | CWH | n | 106.49 | 106.64 | 82 | 106.64 | 0.14% | -0.48% |
| 2018-04-10 | HI | CWH | n | 46.75 | 46.95 | 83 | 46.8 | 0.11% | -0.64% |
| 2018-04-09 | SUPN | CWH | n | 45.20 | 45.35 | 80 | 45.25 | 0.11% | 1.11% |
| 2018-04-11 | VALE | SQZ | y | 13.11 | 13.14 | 88 | 13.12 | 0.08% | -0.69% |
| 2018-04-13 | INXN | SQZ | y | 63.02 | 63.07 | 88 | 63.07 | 0.08% | -1.09% |
| 2018-04-12 | KMPR | SQZ | y | 57.46 | 57.95 | 80 | 57.5 | 0.07% | 0.42% |
| 2018-04-13 | BUFF | SQZ | y | 39.96 | 39.98 | 94 | 39.98 | 0.05% | -0.03% |
| 2018-04-12 | IPCC | SQZ | y | 119.16 | 119.7 | 87 | 119.2 | 0.03% | -0.01% |
| 2018-04-11 | KAMN | SQZ | y | 62.03 | 62.09 | 82 | 62.04 | 0.02% | -0.27% |
| 2018-04-12 | BBX | CWH | y | 9.24 | 9.25 | 87 | 9.24 | 0% | -0.22% |
| 2018-04-11 | DST | SQZ | y | 83.69 | 83.71 | 89 | 83.67 | -0.02% | -0.04% |
| 2018-04-12 | CHEF | SQZ | y | 23.86 | 24.05 | 94 | 23.85 | -0.04% | -0.46% |
| 2018-04-12 | WK | SQZ | y | 24.41 | 24.7 | 86 | 24.4 | -0.04% | -0.04% |
| 2018-04-12 | JAX | SQZ | y | 11.71 | 11.8 | 81 | 11.7 | -0.09% | -0.51% |
| 2018-04-12 | KAMN | SQZ | y | 62.10 | 62.31 | 81 | 62.04 | -0.1% | -0.39% |
| 2018-04-12 | HRS | CWH | n | 161.96 | 162.76 | 89 | 161.69 | -0.17% | 0.01% |
| 2018-04-12 | IIN | SQZ | y | 19.66 | 19.7 | 96 | 19.625 | -0.18% | -1.32% |
| 2018-04-10 | SUPN | SQZ | y | 45.36 | 45.8 | 82 | 45.25 | -0.24% | 0.75% |
| 2018-04-12 | FARO | DB | y | 61.00 | 61.1 | 95 | 60.8 | -0.33% | 0% |
| 2018-04-11 | FARO | DB | y | 61.00 | 61.35 | 95 | 60.8 | -0.33% | 0% |
| 2018-04-12 | RDWR | SQZ | y | 22.23 | 22.29 | 88 | 22.15 | -0.36% | -0.27% |
| 2018-04-12 | SHEN | CWH | n | 37.75 | 37.8 | 84 | 37.55 | -0.53% | -0.93% |
| 2018-04-11 | LEA | DB | y | 194.88 | 194.93 | 85 | 193.7 | -0.61% | 0.06% |
| 2018-04-10 | LEA | DB | y | 194.88 | 195 | 83 | 193.7 | -0.61% | 0.06% |
| 2018-04-12 | LEA | DB | n | 194.88 | 195.86 | 85 | 193.7 | -0.61% | 0.06% |
| 2018-04-12 | RM | SQZ | y | 32.56 | 32.81 | 91 | 32.35 | -0.64% | -0.03% |
| 2018-04-11 | TACT | SQZ | y | 12.86 | 13.2 | 86 | 12.75 | -0.86% | -0.47% |
| 2018-04-10 | RM | SQZ | y | 32.64 | 32.69 | 92 | 32.35 | -0.89% | -0.28% |
| 2018-04-11 | IPAR | SQZ | y | 48.31 | 48.75 | 86 | 47.75 | -1.16% | -0.43% |
| 2018-04-12 | CAR | CWH | n | 49.34 | 49.57 | 91 | 48.74 | -1.22% | -1.5% |
| 2018-04-10 | CAR | CWH | n | 49.34 | 49.78 | 93 | 48.74 | -1.22% | -1.44% |
| 2018-04-10 | RL | CWH | n | 112.75 | 115.05 | 90 | 111.15 | -1.42% | 1.13% |
| 2018-04-12 | ENR | CWH | n | 58.87 | 58.93 | 83 | 58.03 | -1.43% | -1.02% |
| 2018-04-11 | NOAH | SQZ | y | 50.74 | 51.05 | 92 | 49.99 | -1.48% | -1.77% |
| 2018-04-10 | DLTR | SQZ | y | 98.75 | 99.07 | 80 | 97.13 | -1.64% | -0.75% |
| 2018-04-10 | WSO | CWH | n | 186.70 | 187.16 | 84 | 183.41 | -1.76% | -0.62% |
| 2018-04-11 | TGT | SQZ | y | 72.80 | 72.82 | 87 | 71.52 | -1.76% | -0.91% |
| 2018-04-12 | WSO | CWH | n | 186.70 | 187.87 | 83 | 183.41 | -1.76% | -1.16% |
| 2018-04-10 | BAP | CWH | n | 235.23 | 237.09 | 87 | 231 | -1.8% | -0.7% |
| 2018-04-10 | GWW | CWH | n | 289.30 | 292 | 93 | 278.61 | -3.7% | -0.03% |
| 2018-04-10 | NUS | CWH | n | 74.30 | 75.15 | 85 | 71 | -4.44% | 1.1% |
| 2018-04-12 | NUS | SQZ | y | 75.11 | 75.19 | 86 | 71 | -5.47% | 0.01% |
| *RS Rank on day before breakout. | |||||||||
| Symbol | BO Price |
BO Vol. |
Company | Industry | RS Rank |
Last Close |
|---|---|---|---|---|---|---|
| DQ | 58.52 | 682,526 | DAQO New Energy Corp. American Depositary Shares - | Semiconductor Equipment & Materials | 97 | 51.65 |
| CYRX | 10.07 | 201,254 | CryoPort - Inc. - Common Stock | Packaging & Containers | 96 | 8.24 |
| HOME | 34.02 | 721,221 | At Home Group Inc. Common Stock | Foreign Regional Banks | 94 | 33.46 |
| These stocks meet our suggested screening factors
for our Cup and Handle Chart Pattern watchlist. See Revised Rules for Trading Cup and Handle Breakouts |
||||||
| Index | Value | Change Week | Change YTD | Trend1 |
|---|---|---|---|---|
| Dow | 24360.1 |
1.79% | -1.45% | Down |
| NASDAQ | 7106.65 |
2.77% | 2.94% | Down |
| S&P 500 | 2656.3 |
1.99% | -0.65% | Down |
|
1The Market Trend is derived from
our proprietary market model. The market model is described on
the site here.
2The site also shows industry rankings based on fundamentals, combined technical and fundamentals, and on price alone. The site also shows daily industry movements. |
||||
| 1 Week | 13 Weeks | 26 Weeks | Year-to-Date |
|---|---|---|---|
| NASDAQ Composite |
NASDAQ Composite -2.13 % |
NASDAQ Composite 7.58 % |
NASDAQ Composite 2.94 % |
| 1 Week | 3 Weeks | 13 Weeks | 26 Weeks |
|---|---|---|---|
| Manufactured Housing |
Manufactured Housing |
Resorts & Casinos |
Resorts & Casinos |
| Toy & Hobby Stores 132 |
Toy & Hobby Stores 177 |
Manufactured Housing 213 |
Toy & Hobby Stores 196 |
| Charts of each industry rank and performance over 12 months are available on the site | |||
If you received this newsletter from a friend and you would like to receive it regularly please go to the BreakoutWatch.com site and you will then be able to register to receive the newsletter.
Copyright (c) 04/14/2018 NBIcharts, LLC dba BreakoutWatch.com. All
rights reserved.
" BreakoutWatch," the BreakoutWatch.com "eye" logo, and the slogan
"tomorrow's breakouts today" are service marks of NBIcharts LLC. All
other marks are the property of their respective owners, and are used
for descriptive purposes only.
BreakoutWatch is not affiliated with Investor's Business Daily or with Mr. William O'Neil. Our site, research and analysis is supported entirely by subscription and is free from advertising.