Breakoutwatch Weekly Summary 05/18/18
You are receiving this email because you are or were a BreakoutWatch.com subscriber, or have subscribed to our weekly newsletter. This newsletter summarizes the breakout events of the week and provides additional guidance that does not fit into our daily format. It is published each weekend.
| Doji Patterns and Falling Volume
Imply Market Direction Uncertainty The major indexes retreated this week in the face of stalled trade negotiations with China and NAFTA, and a continued rise in Treasury yields which hit 3.11% on Wednesday before slipping back to 3.07% on Friday. These more attractive yields likely pulled some money out of stocks, especially as the risk of trade wars and potential damage to the economy continued. The NASDAQ Composite has been in retreat since Monday and gave up 0.7% for the week. Falling volume on Thursday and Friday and two doji patterns indicate uncertainty about the direction the market will take. Our market trend indicators for the NASDAQ and other major indicators remain positive. 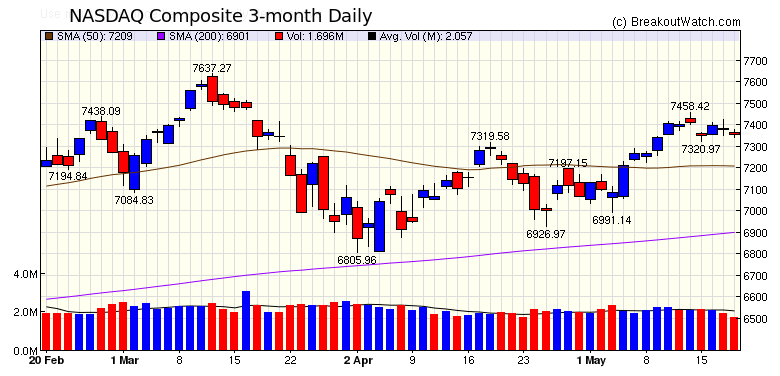 |
| No new features this week |
|
Our latest strategy
suggestions are here.
|
| List | Breakouts | Avg. Gain |
|---|---|---|
| CWH | 6 | 2.78 |
| SQZ | 0 | |
| HTF | 0 | |
| HSB | 0 | |
| DB | 0 |
| Brkout Date | Symbol | Base | Squeeze | BrkoutOut Price | Brkout Day Close | RS Rank* | Last Close | Current % off BOP | Gain at Intraday High |
|---|---|---|---|---|---|---|---|---|---|
| 2018-05-16 | M | CWH | n | 31.44 | 33.17 | 87 | 33.96 | 8.02% | 4.83% |
| 2018-05-16 | PTCT | CWH | n | 30.78 | 31.07 | 95 | 31.99 | 3.93% | 1.79% |
| 2018-05-16 | LXFR | CWH | n | 16.25 | 16.49 | 83 | 16.88 | 3.88% | 2.77% |
| 2018-05-15 | DTYS | CWH | n | 23.95 | 24.64 | 84 | 24.43 | 2% | 3.51% |
| 2018-05-15 | TX | CWH | n | 40.00 | 40.44 | 88 | 39.81 | -0.47% | 1.45% |
| 2018-05-16 | JOUT | CWH | n | 75.20 | 75.51 | 83 | 74.69 | -0.68% | -0.45% |
| *RS Rank on day before breakout. | |||||||||
| Symbol | BO Price |
BO Vol. |
Company | Industry | RS Rank |
Last Close |
|---|---|---|---|---|---|---|
| MAR | 138.96 | 2,663,498 | Marriott International - Class A Common Stock | Lodging | 97 | 138.52 |
| COOL | 27.80 | 319,266 | PolarityTE - Inc. - Common Stock | Multimedia & Graphics Software | 94 | 26.96 |
| These stocks meet our suggested screening factors
for our Cup and Handle Chart Pattern watchlist. See Revised Rules for Trading Cup and Handle Breakouts |
||||||
| Index | Value | Change Week | Change YTD | Trend1 |
|---|---|---|---|---|
| Dow | 24715.1 |
-0.47% | -0.02% | Up |
| NASDAQ | 7354.34 |
-0.66% | 6.53% | Up |
| S&P 500 | 2712.97 |
-0.54% | 1.47% | Up |
|
1The Market Trend is derived from
our proprietary market model. The market model is described on
the site here.
2The site also shows industry rankings based on fundamentals, combined technical and fundamentals, and on price alone. The site also shows daily industry movements. |
||||
| 1 Week | 13 Weeks | 26 Weeks | Year-to-Date |
|---|---|---|---|
| Dow Jones |
NASDAQ Composite 1.59 % |
NASDAQ Composite 8.43 % |
NASDAQ Composite 6.53 % |
| 1 Week | 3 Weeks | 13 Weeks | 26 Weeks |
|---|---|---|---|
| Manufactured Housing |
Manufactured Housing |
Home Health Care |
Resorts & Casinos |
| Meat Products 126 |
Long Distance Carriers 177 |
Manufactured Housing 213 |
Sporting Goods Stores 197 |
| Charts of each industry rank and performance over 12 months are available on the site | |||
If you received this newsletter from a friend and you would like to receive it regularly please go to the BreakoutWatch.com site and you will then be able to register to receive the newsletter.
Copyright (c) 05/18/2018 NBIcharts, LLC dba BreakoutWatch.com. All
rights reserved.
" BreakoutWatch," the BreakoutWatch.com "eye" logo, and the slogan
"tomorrow's breakouts today" are service marks of NBIcharts LLC. All
other marks are the property of their respective owners, and are used
for descriptive purposes only.
BreakoutWatch is not affiliated with Investor's Business Daily or with Mr. William O'Neil. Our site, research and analysis is supported entirely by subscription and is free from advertising.