Breakoutwatch Weekly Summary 11/10/18
You are receiving this email because you are or were a BreakoutWatch.com subscriber, or have subscribed to our weekly newsletter. This newsletter summarizes the breakout events of the week and provides additional guidance that does not fit into our daily format. It is published each weekend.
| A Good Week for Breakouts but
Volatility Suggests Taking Profits Early The election result gave a strong lift to the market on Wednesday as Democrats took control of the House as anticipated. Market analysts attributed the surge to a belief that a divided congress means a stalemate that will deny either side the ability to disrupt the current 'Goldilocks' environment. Spirits were dampened on Thursday, however, when the Fed announced it expected to continue to raise interest rates. The NASDAQ turned down on Thursday and then gapped lower on Friday, leaving the index with just a 0.7% gain for the week. Our trend indicators for the three major indicators remain negative. Our backtesting suggests it is wise to avoid opening long positions while this condition persists. Nevertheless, there certainly can be short term gains to be had. As can be seen from the Breakouts Summary below, cup and handle and volatility squeeze breakouts were numerous, mostly on Wednesday, but if you look at the Breakouts Detail report, you will see that many of the gains were curtailed by Friday. This suggests that when volatility is high, it is wise to take profits early. 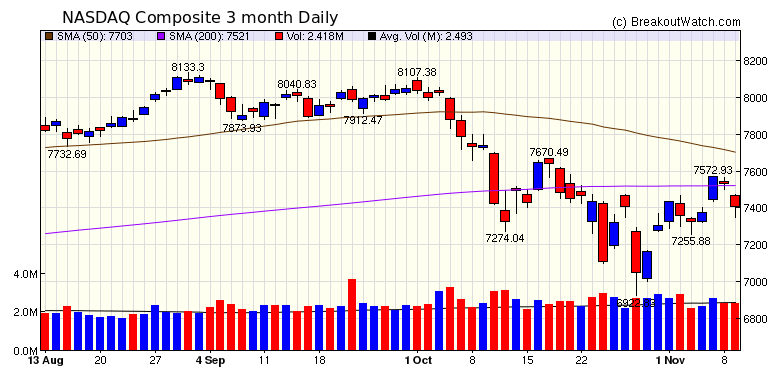 |
| No new features this week |
|
Our latest strategy
suggestions are here.
|
| List | Breakouts | Avg. Gain |
|---|---|---|
| CWH | 12 | 5.36 |
| SQZ | 10 | 0.46 |
| HTF | 0 | |
| HSB | 0 | |
| DB | 3 | 1.99 |
| Brkout Date | Symbol | Base | Squeeze | BrkoutOut Price | Brkout Day Close | RS Rank* | Last Close | Current % off BOP | Gain at Intraday High |
|---|---|---|---|---|---|---|---|---|---|
| 2018-11-07 | VIVO | CWH | n | 16.63 | 16.98 | 81 | 19.72 | 18.58% | 19.3% |
| 2018-11-07 | HCI | CWH | n | 46.10 | 50.72 | 89 | 54.19 | 17.55% | 17.83% |
| 2018-11-07 | GLUU | CWH | n | 7.41 | 8.1 | 95 | 8.07 | 8.91% | 13.63% |
| 2018-11-08 | WMGI | SQZ | y | 27.74 | 29.75 | 85 | 30.19 | 8.83% | 10.85% |
| 2018-11-07 | DXCM | CWH | n | 138.00 | 144.65 | 98 | 149.46 | 8.3% | 10.25% |
| 2018-11-08 | CYBR | DB | y | 72.27 | 78 | 93 | 77.33 | 7% | 16.52% |
| 2018-11-07 | STAA | SQZ | y | 44.11 | 50 | 98 | 47 | 6.55% | 16.3% |
| 2018-11-07 | MLNX | CWH | n | 88.95 | 92.74 | 92 | 93.37 | 4.97% | 11.46% |
| 2018-11-06 | FIX | CWH | n | 55.30 | 58.15 | 86 | 57.82 | 4.56% | 8.19% |
| 2018-11-07 | DDS | SQZ | y | 76.44 | 79.4 | 82 | 79.5 | 4% | 4.07% |
| 2018-11-08 | WK | SQZ | y | 37.17 | 39.94 | 95 | 38.57 | 3.77% | 9.87% |
| 2018-11-07 | DATA | CWH | n | 110.49 | 121.16 | 87 | 114.11 | 3.28% | 13.58% |
| 2018-11-09 | SHEN | CWH | n | 43.28 | 44.67 | 90 | 44.67 | 3.21% | 3.56% |
| 2018-11-07 | TGT | SQZ | y | 85.57 | 86.76 | 87 | 86.94 | 1.6% | 2.76% |
| 2018-11-08 | BAH | SQZ | y | 50.78 | 50.87 | 87 | 51.41 | 1.24% | 1.4% |
| 2018-11-09 | OFG | CWH | n | 18.07 | 18.25 | 95 | 18.25 | 1% | 1.33% |
| 2018-11-07 | V | DB | n | 142.86 | 144.78 | 81 | 143.93 | 0.75% | 1.82% |
| 2018-11-08 | ALRM | SQZ | y | 47.26 | 49.65 | 80 | 47.27 | 0.02% | 18.62% |
| 2018-11-07 | DAR | CWH | n | 21.51 | 21.62 | 82 | 21.48 | -0.14% | 2.79% |
| 2018-11-08 | MANT | SQZ | y | 60.71 | 61.04 | 80 | 60.42 | -0.48% | 1.61% |
| 2018-11-08 | TTEK | DB | y | 70.04 | 72.33 | 89 | 68.79 | -1.78% | 3.6% |
| 2018-11-07 | NHC | CWH | n | 81.98 | 82.53 | 88 | 80.48 | -1.83% | 3.56% |
| 2018-11-07 | PETX | CWH | n | 6.95 | 6.97 | 92 | 6.67 | -4.03% | 3.02% |
| 2018-11-07 | NVTA | SQZ | y | 14.34 | 14.46 | 98 | 13.01 | -9.27% | 12.06% |
| 2018-11-07 | FATE | SQZ | y | 14.52 | 15.1 | 98 | 12.82 | -11.71% | 10.06% |
| *RS Rank on day before breakout. | |||||||||
| Symbol | BO Price |
BO Vol. |
Company | Industry | RS Rank |
Last Close |
|---|---|---|---|---|---|---|
| These stocks meet our suggested screening factors
for our Cup and Handle Chart Pattern watchlist. See Revised Rules for Trading Cup and Handle Breakouts |
||||||
| Index | Value | Change Week | Change YTD | Trend1 |
|---|---|---|---|---|
| Dow | 25989.3 |
2.84% | 5.14% | Down |
| NASDAQ | 7406.9 |
0.68% | 7.29% | Down |
| S&P 500 | 2781.01 |
2.13% | 4.02% | Down |
|
1The Market Trend is derived from
our proprietary market model. The market model is described on
the site here.
2The site also shows industry rankings based on fundamentals, combined technical and fundamentals, and on price alone. The site also shows daily industry movements. |
||||
| 1 Week | 13 Weeks | 26 Weeks | Year-to-Date |
|---|---|---|---|
| Dow Jones |
Dow Jones 2.67 % |
Dow Jones 4.66 % |
NASDAQ Composite 7.29 % |
| 1 Week | 3 Weeks | 13 Weeks | 26 Weeks |
|---|---|---|---|
| Tobacco Products - Other |
Foreign Utilities |
Auto Parts Stores |
Auto Parts Stores |
| Major Integrated Oil & Gas 115 |
Manufactured Housing 174 |
Music & Video Stores 211 |
Music & Video Stores 212 |
| Charts of each industry rank and performance over 12 months are available on the site | |||
If you received this newsletter from a friend and you would like to receive it regularly please go to the BreakoutWatch.com site and you will then be able to register to receive the newsletter.
Copyright (c) 11/10/2018 NBIcharts, LLC dba BreakoutWatch.com. All
rights reserved.
" BreakoutWatch," the BreakoutWatch.com "eye" logo, and the slogan
"tomorrow's breakouts today" are service marks of NBIcharts LLC. All
other marks are the property of their respective owners, and are used
for descriptive purposes only.
BreakoutWatch is not affiliated with Investor's Business Daily or with Mr. William O'Neil. Our site, research and analysis is supported entirely by subscription and is free from advertising.