Breakoutwatch Weekly Summary 03/16/19
You are receiving this email because you are or were a BreakoutWatch.com subscriber, or have subscribed to our weekly newsletter. This newsletter summarizes the breakout events of the week and provides additional guidance that does not fit into our daily format. It is published each weekend.
| Strong Breakouts Return as NASDAQ
Surges The NASDAQ gapped up on Monday following comments by Fed Chairman Powell on Sunday's 60 minutes TV program. The Fed Chairman reiterated that the Fed would be patient in its approach to raising interest rates. Monday's action saw a breakthrough of the 200 day resistance level and the upward trend continued Throughout the week, except for some minor profit taking on Thursday. Friday brought another opening gap up on news of 'concrete' progress in trade talks with China. Technology stocks. Top breakout of the week was INS which broke out of a Volatility Squeeze to gain 49.3%. 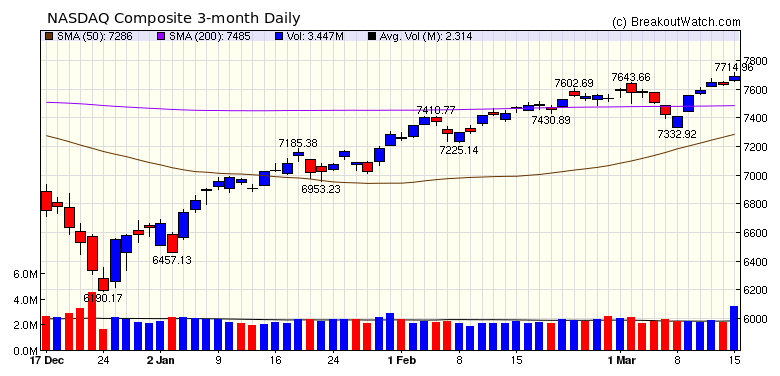 |
| No new features this week |
|
Our latest strategy
suggestions are here.
|
| List | Breakouts | Avg. Gain |
|---|---|---|
| CWH | 16 | 1.27 |
| SQZ | 9 | 6.63 |
| HTF | 0 | |
| HSB | 0 | |
| DB | 0 |
| Brkout Date | Symbol | Base | Squeeze | Brkout Price | Brkout Day Close | RS Rank* | Last Close | Current % off BOP | Gain at Intraday High |
|---|---|---|---|---|---|---|---|---|---|
| 2019-03-11 | INS | SQZ | y | 20.26 | 24.2 | 99 | 30.25 | 49.31% | 50.1% |
| 2019-03-15 | ULTA | CWH | n | 318.78 | 338.41 | 93 | 338.41 | 6.16% | 8.3% |
| 2019-03-13 | ELP | SQZ | y | 9.62 | 9.94 | 96 | 10.07 | 4.68% | 6.55% |
| 2019-03-15 | CATS | CWH | n | 13.32 | 13.82 | 94 | 13.82 | 3.75% | 12.69% |
| 2019-03-14 | WWE | CWH | y | 89.63 | 90.63 | 96 | 92.37 | 3.06% | 4.52% |
| 2019-03-12 | OXFD | CWH | n | 17.68 | 17.8 | 84 | 18.2 | 2.94% | 5.2% |
| 2019-03-13 | CIB | CWH | n | 49.87 | 50.05 | 86 | 51.1 | 2.47% | 3.33% |
| 2019-03-15 | MAG | CWH | n | 10.71 | 10.92 | 92 | 10.92 | 1.96% | 2.43% |
| 2019-03-14 | LBRDK | SQZ | y | 90.82 | 91.66 | 80 | 92.39 | 1.73% | 2.15% |
| 2019-03-15 | VSAT | SQZ | y | 76.28 | 77.29 | 83 | 77.29 | 1.32% | 1.82% |
| 2019-03-15 | MTD | CWH | n | 701.25 | 708.58 | 86 | 708.58 | 1.05% | 1.19% |
| 2019-03-15 | LBRDK | SQZ | y | 91.67 | 92.39 | 81 | 92.39 | 0.79% | 1.2% |
| 2019-03-15 | BAP | SQZ | y | 246.48 | 248.28 | 81 | 248.28 | 0.73% | 1.67% |
| 2019-03-15 | AGX | CWH | y | 49.01 | 49.35 | 90 | 49.35 | 0.69% | 1.63% |
| 2019-03-15 | EBF | CWH | n | 21.66 | 21.79 | 84 | 21.79 | 0.6% | 1.57% |
| 2019-03-15 | G | SQZ | y | 33.92 | 34.11 | 84 | 34.11 | 0.56% | 0.71% |
| 2019-03-15 | ADP | CWH | y | 154.55 | 155.31 | 84 | 155.31 | 0.49% | 0.52% |
| 2019-03-15 | JCAP | SQZ | y | 21.58 | 21.68 | 82 | 21.68 | 0.46% | 1.07% |
| 2019-03-15 | SYF | CWH | n | 33.25 | 33.31 | 80 | 33.31 | 0.18% | 0.21% |
| 2019-03-13 | BAM | CWH | n | 46.18 | 46.42 | 81 | 46.23 | 0.11% | 1.08% |
| 2019-03-15 | DENN | SQZ | y | 17.99 | 18 | 81 | 18 | 0.06% | 1.39% |
| 2019-03-13 | TITN | CWH | n | 20.25 | 20.69 | 82 | 20.22 | -0.15% | 2.97% |
| 2019-03-11 | ANF | CWH | n | 26.59 | 26.64 | 91 | 26.39 | -0.75% | 1.92% |
| 2019-03-11 | TCP | CWH | n | 35.62 | 35.69 | 83 | 35.35 | -0.76% | 3.31% |
| 2019-03-11 | NS | CWH | y | 27.16 | 27.32 | 88 | 26.77 | -1.44% | 1.03% |
| *RS Rank on day before breakout. | |||||||||
| Symbol | BO Price |
BO Vol. |
Company | Industry | RS Rank |
Last Close |
|---|---|---|---|---|---|---|
| No stocks met our suggested screening factors for
our Cup and Handle Chart Pattern watchlist. See Revised Rules for Trading Cup and Handle Breakouts |
||||||
| Index | Value | Change Week | Change YTD | Trend1 |
|---|---|---|---|---|
| Dow | 25848.9 |
1.6% | 10.81% | Up |
| NASDAQ | 7688.53 |
3.8% | 15.87% | Up |
| S&P 500 | 2822.48 |
2.9% | 12.59% | Up |
|
1The Market Trend is derived from
our proprietary market model. The market model is described on
the site here.
2The site also shows industry rankings based on fundamentals, combined technical and fundamentals, and on price alone. The site also shows daily industry movements. |
||||
| 1 Week | 13 Weeks | 26 Weeks | Year-to-Date |
|---|---|---|---|
| NASDAQ Composite |
NASDAQ Composite 7.25 % |
Dow Jones -1.17 % |
NASDAQ Composite 15.87 % |
| 1 Week | 3 Weeks | 13 Weeks | 26 Weeks |
|---|---|---|---|
| Foreign Utilities |
Foreign Utilities |
Foreign Utilities |
Auto Parts Stores |
| Multimedia & Graphics Software 105 |
Hospitals 94 |
Music & Video Stores 208 |
Music & Video Stores 215 |
| Charts of each industry rank and performance over 12 months are available on the site | |||
If you received this newsletter from a friend and you would like to receive it regularly please go to the BreakoutWatch.com site and you will then be able to register to receive the newsletter.
Copyright (c) 03/16/2019 NBIcharts, LLC dba BreakoutWatch.com. All
rights reserved.
" BreakoutWatch," the BreakoutWatch.com "eye" logo, and the slogan
"tomorrow's breakouts today" are service marks of NBIcharts LLC. All
other marks are the property of their respective owners, and are used
for descriptive purposes only.
BreakoutWatch is not affiliated with Investor's Business Daily or with Mr. William O'Neil. Our site, research and analysis is supported entirely by subscription and is free from advertising.