Breakoutwatch Weekly Summary 03/30/19
You are receiving this email because you are or were a BreakoutWatch.com subscriber, or have subscribed to our weekly newsletter. This newsletter summarizes the breakout events of the week and provides additional guidance that does not fit into our daily format. It is published each weekend.
| Tepid Volume Limits Breakout
Performance The NASDAQ Composite gained 1.1% this week but did so on mostly less than average volume that kept the index flat for the first 4 days. Evidence that the economy is slowing appeared on Thursday as the Treasury revised 4th quarter growth down from 2.6% to 2.2% but Friday brought positive news and an uptick in volume as the Treasury yield curve re-inverted allaying fears that a recession was due in 2020. Although stocks generally moved higher the number of confirmed breakouts fell from 14 last week to just 8 this week. This is because confirmation requires that breakout volume be at least 1.5 times the 50 day average volume. If volumes remain low then this low breakout rate will continue. 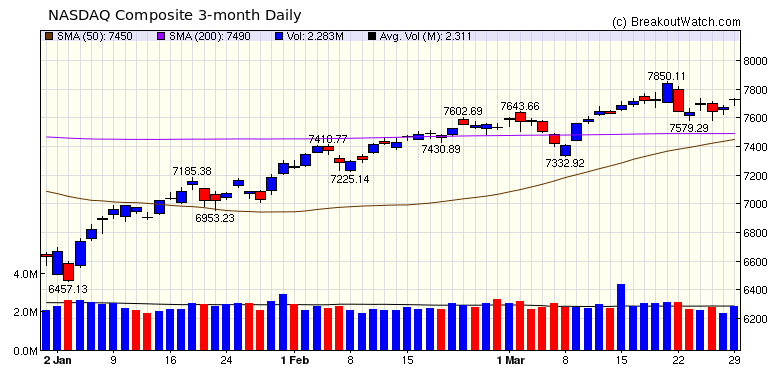 |
| No new features this week |
|
Our latest strategy
suggestions are here.
|
| List | Breakouts | Avg. Gain |
|---|---|---|
| CWH | 5 | 1.8 |
| SQZ | 3 | 1.56 |
| HTF | 0 | |
| HSB | 0 | |
| DB | 0 |
| Brkout Date | Symbol | Base | Squeeze | Brkout Price | Brkout Day Close | RS Rank* | Last Close | Current % off BOP | Gain at Intraday High |
|---|---|---|---|---|---|---|---|---|---|
| 2019-03-27 | LULU | CWH | y | 158.67 | 161.85 | 87 | 163.87 | 3.28% | 8.05% |
| 2019-03-27 | LXFR | CWH | n | 24.24 | 24.73 | 92 | 24.98 | 3.05% | 3.55% |
| 2019-03-26 | NVS | CWH | n | 93.89 | 95.02 | 81 | 96.14 | 2.4% | 2.58% |
| 2019-03-26 | COTY | SQZ | y | 11.24 | 11.27 | 84 | 11.49 | 2.22% | 2.49% |
| 2019-03-26 | EVA | SQZ | y | 31.64 | 31.66 | 80 | 32.25 | 1.93% | 3.89% |
| 2019-03-28 | COTY | SQZ | y | 11.43 | 11.5 | 85 | 11.49 | 0.52% | 0.79% |
| 2019-03-29 | DPG | CWH | n | 14.90 | 14.94 | 82 | 14.94 | 0.27% | 0.67% |
| 2019-03-29 | ZGNX | CWH | n | 55.00 | 55.01 | 92 | 55.01 | 0.02% | 2.73% |
| *RS Rank on day before breakout. | |||||||||
| Symbol | BO Price |
BO Vol. |
Company | Industry | RS Rank |
Last Close |
|---|---|---|---|---|---|---|
| No stocks met our suggested screening factors for
our Cup and Handle Chart Pattern watchlist. See Revised Rules for Trading Cup and Handle Breakouts |
||||||
| Index | Value | Change Week | Change YTD | Trend1 |
|---|---|---|---|---|
| Dow | 25928.7 |
1.7% | 11.15% | Up |
| NASDAQ | 7729.32 |
1.1% | 16.49% | Up |
| S&P 500 | 2834.4 |
1.2% | 13.07% | Up |
|
1The Market Trend is derived from
our proprietary market model. The market model is described on
the site here.
2The site also shows industry rankings based on fundamentals, combined technical and fundamentals, and on price alone. The site also shows daily industry movements. |
||||
| 1 Week | 13 Weeks | 26 Weeks | Year-to-Date |
|---|---|---|---|
| Dow Jones |
NASDAQ Composite 12.43 % |
Dow Jones -2 % |
NASDAQ Composite 16.49 % |
| 1 Week | 3 Weeks | 13 Weeks | 26 Weeks |
|---|---|---|---|
| Foreign Utilities |
Foreign Utilities |
Foreign Utilities |
Auto Parts Stores |
| Air Services - Other 103 |
Internet Service Providers 106 |
Music & Video Stores 209 |
Foreign Utilities 207 |
| Charts of each industry rank and performance over 12 months are available on the site | |||
If you received this newsletter from a friend and you would like to receive it regularly please go to the BreakoutWatch.com site and you will then be able to register to receive the newsletter.
Copyright (c) 03/30/2019 NBIcharts, LLC dba BreakoutWatch.com. All
rights reserved.
" BreakoutWatch," the BreakoutWatch.com "eye" logo, and the slogan
"tomorrow's breakouts today" are service marks of NBIcharts LLC. All
other marks are the property of their respective owners, and are used
for descriptive purposes only.
BreakoutWatch is not affiliated with Investor's Business Daily or with Mr. William O'Neil. Our site, research and analysis is supported entirely by subscription and is free from advertising.