Breakoutwatch Weekly Summary 07/07/2023
You are receiving this email because you are or were a
BreakoutWatch.com subscriber, or have subscribed to our weekly
newsletter.
To read this newsletter on the site, click here: Newsletter
.
Contents
Special July 4 Offer: 6 months for the price of 3
Enroll for a free trial and then Subscribe for 3 months ($105) and receive a 6 month Subscription ($187 value)
Email me after you have subscribed to receive the subscription extension
(Offer not available to current subscribers)
Market Summary
Favorable macro backdrop helps end solid quarter on solid note
Positive growth and inflation surprises helped the major benchmarks round out a solid quarter on a high note, with the S&P 500 Index recording its best weekly gain since the end of March. The rally also broadened, with small-caps and value shares outperforming, and the equal-weighted S&P 500 Index handily outpacing its market-weighted counterpart. The technology-heavy Nasdaq Composite remained well ahead of the other benchmarks for the year-to-date, however, ending the week with a six-month gain of nearly 32%, its best start to the year since 1983. [more...]
Major Index Performance
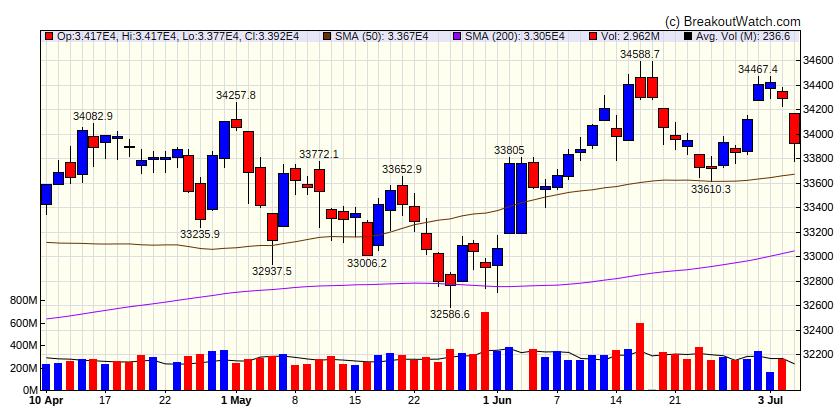
| Dow Jones | |
|---|---|
| Last Close | 33922.3 |
| Wk. Gain | -1.3 % |
| Yr. Gain | 2.42 % |
| Trend | Down |
|
|
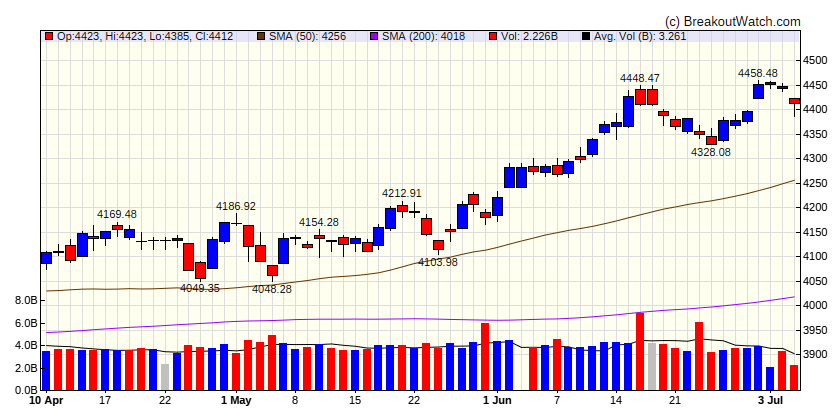
| S&P 500 | |
|---|---|
| Last Close | 4411.59 |
| Wk. Gain | -0.87 % |
| Yr. Gain | 15.21 % |
| Trend | Up |
|
|
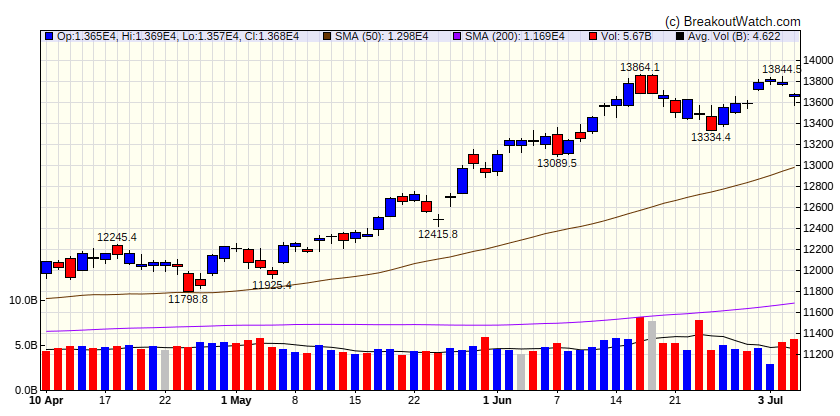
| NASDAQ Comp. | |
|---|---|
| Last Close | 13679 |
| Wk. Gain | -0.87 % |
| Yr. Gain | 31.93 % |
| Trend | Up |
|
|
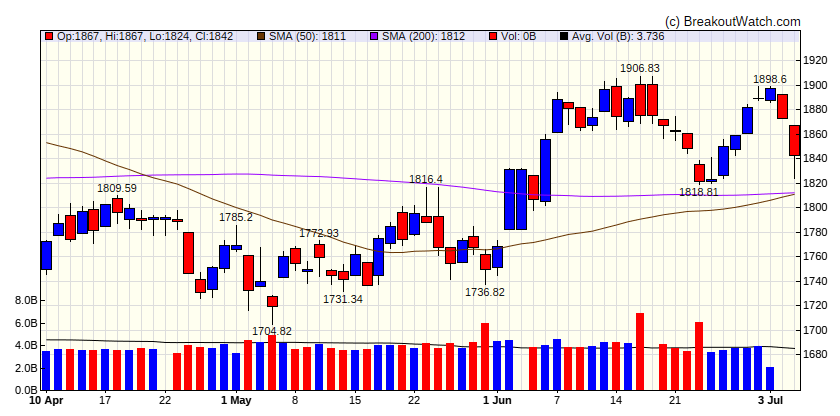
| Russell 2000 | |
|---|---|
| Last Close | 1842.23 |
| Wk. Gain | -2.37 % |
| Yr. Gain | 4.1 % |
| Trend | Down |
|
|
Performance by Sector
| Sector | Wk. Change % | Yr. Change % | Trend |
|---|---|---|---|
| Consumer Discretionary | -1.52 | 29.43 | Up |
| Consumer Staples | 0.32 | 1.48 | Up |
| Energy | -2.67 | -8.09 | Up |
| Finance | -0.8 | -2.11 | Up |
| Health Care | -1.41 | -2.85 | Up |
| Industrials | -1.26 | 10.94 | Up |
| Technology | -1.22 | 38.18 | Up |
| Materials | -2.63 | 4.01 | Up |
| REIT | 0.59 | 1.75 | Up |
| Telecom | 0.19 | 30.95 | Up |
| Utilities | 0.78 | -7.73 | Down |
Breakouts This Week Still Within 5% of Breakout Price (Limit 20 top C Score)
| Watchlist | Symbol | Company | Industry | C Score* | % Gain |
|---|---|---|---|---|---|
| CWH | MRAM | Everspin Technologies, Inc. | Semiconductors | 82.8 % | 0.3 % |
| SQZ | IBKR | Interactive Brokers Group, Inc. | Capital Markets | 81.9 % | 1.8 % |
| SQZ | OII | Oceaneering International, Inc. | Oil & Gas Equipment & Services | 80.2 % | 1.7 % |
| SQZ | ACGL | Arch Capital Group Ltd. | Insurance - Diversified | 80.1 % | 1.1 % |
| SQZ | CHX | ChampionX Corporation | Oil & Gas Equipment & Services | 78.8 % | 0.7 % |
| SQZ | PCG | Pacific Gas & Electric Co. | Utilities - Regulated Electric | 77.8 % | 2.6 % |
| SQZ | MTRN | Materion Corporation | Other Industrial Metals & Mining | 73.9 % | 2 % |
| SQZ | HLX | Helix Energy Solutions Group, Inc. | Oil & Gas Equipment & Services | 70.8 % | 0.8 % |
| SQZ | MUSA | Murphy USA Inc. | Specialty Retail | 67.8 % | 1.3 % |
| CWH | BVH | Bluegreen Vacations Holding Corporation Class A | Resorts & Casinos | 67.4 % | 0.8 % |
| SQZ | DVA | DaVita Inc. | Medical Care Facilities | 67.1 % | 1.5 % |
| CWH | GENC | Gencor Industries, Inc. | Farm & Heavy Construction Machinery | 61.1 % | 0.8 % |
| SQZ | GFL | GFL Environmental Inc. | Waste Management | 60.6 % | 0.6 % |
| SQZ | PCGU | Pacific Gas & Electric Co | Utilities - Regulated Electric | 39 % | 1.2 % |
| *C score is our assessment of a Stock's correlation to CAN SLIM principles. It combines a stock's Technical and Fundamental merits and is expressed as a percentage. | |||||
Breakdowns within 5% of Breakdown Price
| Watchlist | Symbol | Company | Industry | C Score* | % Loss |
|---|---|---|---|---|---|
| SS | AROC | Archrock, Inc. | Oil & Gas Equipment & Services | 77.7 % | -0.8 % |
| SS | OI | O-I Glass, Inc. | Packaging & Containers | 71.9 % | -2.3 % |
| SS | MRK | Merck & Company, Inc. | Drug Manufacturers - General | 69.8 % | -1.7 % |
| SS | HRMY | Harmony Biosciences Holdings, Inc. | Biotechnology | 69.6 % | -1.9 % |
| SS | CASS | Cass Information Systems, Inc. | Specialty Business Services | 65.7 % | -2.3 % |
| SS | ASR | Grupo Aeroportuario del Sureste, S. A. B. de C. V. | Airports & Air Services | 64.5 % | -2.2 % |
| SS | IBCP | Independent Bank Corporation | Banks - Regional | 64 % | -2.7 % |
| SS | AR | Antero Resources Corporation | Oil & Gas E&P | 62.7 % | -0.4 % |
| SS | MCRI | Monarch Casino & Resort, Inc. | Resorts & Casinos | 62 % | -3.1 % |
| SS | EBF | Ennis, Inc. | Business Equipment & Supplies | 61.6 % | -0.2 % |
| SS | COP | ConocoPhillips | Oil & Gas E&P | 59.8 % | -1.9 % |
| SS | PVH | PVH Corp. | Apparel Manufacturing | 59.5 % | -0 % |
| SS | IVR | Invesco Mortgage Capital Inc. | Banks - Global | 57.5 % | -1.2 % |
| SS | FORG | ForgeRock, Inc. | Software - Infrastructure | 55.9 % | -0.6 % |
| SS | ATEN | A10 Networks, Inc. | Software - Infrastructure | 55.4 % | -2.4 % |
| SS | BE | Bloom Energy Corporation Class A | Electrical Equipment & Parts | 53.4 % | -1.8 % |
| SS | GRTX | Galera Therapeutics, Inc. | Biotechnology | 51.2 % | -3 % |
| SS | GES | Guess?, Inc. | Apparel Retail | 50.6 % | -0.2 % |
| SS | FRGI | Fiesta Restaurant Group, Inc. | Restaurants | 48.6 % | -4.4 % |
| SS | TAL | TAL Education Group | Education & Training Services | 46.6 % | -4 % |
| SS | SNDX | Syndax Pharmaceuticals, Inc. | Biotechnology | 42.5 % | -1.6 % |
| *C score is our assessment of a Stock's correlation to CAN SLIM principles. It combines a stock's Technical and Fundamental merits and is expressed as a percentage. | |||||
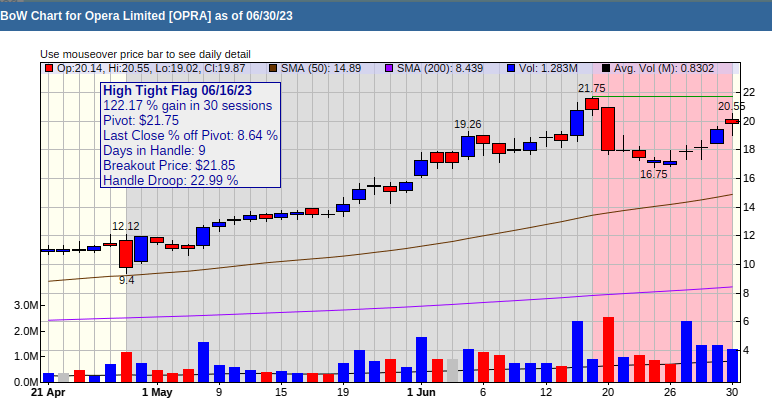
High Tight Flag Chart of the Week
Opera Limited (OPRA) Opera gained 117% in 30 sessions and has a relative strength Rank of 99. High flying stocks can fly higher and Opera is climbing again after some recent profit taking.