Breakoutwatch Weekly Summary 07/24/2023
You are receiving this email because you are or were a
BreakoutWatch.com subscriber, or have subscribed to our weekly
newsletter.
To read this newsletter on the site, click here: Newsletter
.
Special July 4 Offer: 6 months for the price of 3
Enroll for a free trial and then Subscribe for 3 months ($105) and receive a 6 month Subscription ($187 value)
Email me after you have subscribed to receive the subscription extension
(Offer not available to current subscribers)
Market Summary
Retail sales increased modestly in June; initial jobless claims decline
Most of the major U.S. equity indexes advanced on hopes that the tight labor market and moderating inflation would help the economy avoid a hard landing. The tech-heavy Nasdaq Composite, however, suffered a modest pullback. Value stocks outperformed their growth counterparts in the large-cap Russell 1000 Index. [more...]
Major Index Performance
| Dow Jones
|
| Last Close
| |
| Wk. Gain
| -100 % |
| Yr. Gain
| -100 % |
| Trend
| Up |
|
| S&P 500
|
| Last Close
| 0 |
| Wk. Gain
| -100 % |
| Yr. Gain
| -100 % |
| Trend
| Up |
|
| NASDAQ Comp.
|
| Last Close
| 0 |
| Wk. Gain
| -100 % |
| Yr. Gain
| -100 % |
| Trend
| Up |
|
| Russell 2000
|
| Last Close
| 0 |
| Wk. Gain
| -100 % |
| Yr. Gain
| -100 % |
| Trend
| Up |
|
Performance by Sector
| Sector |
Wk. Change % |
Yr. Change % |
Trend |
| Consumer Discretionary |
-100 |
-100 |
Up |
| Consumer Staples |
-100 |
-100 |
Up |
| Energy |
-100 |
-100 |
Up |
| Finance |
-100 |
-100 |
Up |
| Health Care |
-100 |
-100 |
Down |
| Industrials |
-100 |
-100 |
Up |
| Technology |
-100 |
-100 |
Up |
| Materials |
-100 |
-100 |
Up |
| REIT |
-100 |
-100 |
Up |
| Telecom |
-100 |
-100 |
Up |
| Utilities |
-100 |
-100 |
Down |
Breakouts This Week Still Within 5% of Breakout Price (Limit 20 top C Score)
| Watchlist |
Symbol |
Company |
Industry |
C Score* |
% Gain |
| *C score is our assessment of a Stock's correlation to CAN SLIM principles. It combines a stock's Technical and Fundamental merits and is expressed as a percentage. |
Breakdowns within 5% of Breakdown Price
| Watchlist |
Symbol |
Company |
Industry |
C Score* |
% Loss |
There were no Breakdowns still within 5% of breakdown price this week |
| *C score is our assessment of a Stock's correlation to CAN SLIM principles. It combines a stock's Technical and Fundamental merits and is expressed as a percentage. |
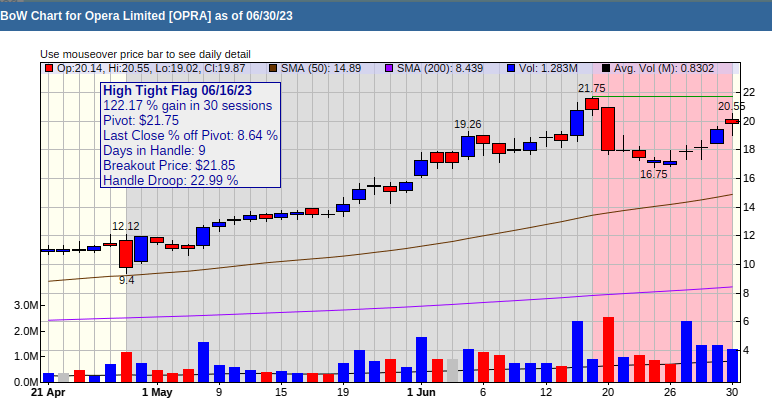
High Tight Flag Chart of the Week
Opera Limited (OPRA) Opera gained 117% in 30 sessions and has a relative strength Rank of 99. High flying stocks can fly higher and Opera is climbing again after some recent profit taking.