Breakoutwatch Weekly Summary 11/04/2023
You are receiving this email because you are or were a
BreakoutWatch.com subscriber, or have subscribed to our weekly
newsletter.
To read this newsletter on the site, click here: Newsletter
.
Market Summary
Stocks see best gain since November 2022 on falling yields
The S&P 500 Index recorded its strongest weekly gain in nearly a year, as signs of a slowing economy and a policy statement from the Federal Reserve that was generally perceived as dovish led to a sharp decrease in long-term bond yields. Growth stocks and the technology-heavy Nasdaq Composite Index outperformed somewhat, but the gains were broad-based and led by the small-cap Russell 2000 Index, which scored its best weekly gain since October 2022. [more...]
Major Index Performance
| Dow Jones
|
| Last Close
| 34061.3 |
| Wk. Gain
| 4.68 % |
| Yr. Gain
| 2.75 % |
| Trend
| Up |
|
| S&P 500
|
| Last Close
| 34061.3 |
| Wk. Gain
| 722.86 % |
| Yr. Gain
| 784.02 % |
| Trend
| Down |
|
| NASDAQ Comp.
|
| Last Close
| 34061.3 |
| Wk. Gain
| 167.14 % |
| Yr. Gain
| 222.49 % |
| Trend
| Down |
|
| Russell 2000
|
| Last Close
| 34061.3 |
| Wk. Gain
| 1968.89 % |
| Yr. Gain
| 1824.37 % |
| Trend
| Down |
|
Performance by Sector
| Sector |
Wk. Change % |
Yr. Change % |
Trend |
| Consumer Discretionary |
13360.3 |
15565.41 |
Up |
| Consumer Staples |
17419.44 |
17020.53 |
Up |
| Energy |
43334.46 |
64716.94 |
Down |
| Finance |
47286.34 |
44383.87 |
Up |
| Health Care |
17589.59 |
20083.28 |
Down |
| Industrials |
23486.52 |
23486.52 |
Down |
| Technology |
15444.59 |
15444.59 |
Down |
| Materials |
27300.29 |
27300.29 |
Up |
| REIT |
36466.08 |
36466.08 |
Up |
| Telecom |
38961.12 |
38961.12 |
Down |
| Utilities |
24043.25 |
24043.25 |
Up |
Breakouts This Week Still Within 5% of Breakout Price (Limit 20 top C Score)
| Watchlist |
Symbol |
Company |
Industry |
C Score* |
% Gain |
| *C score is our assessment of a Stock's correlation to CAN SLIM principles. It combines a stock's Technical and Fundamental merits and is expressed as a percentage. |
Breakdowns within 5% of Breakdown Price
| Watchlist |
Symbol |
Company |
Industry |
C Score* |
% Loss |
There were no Breakdowns still within 5% of breakdown price this week |
| *C score is our assessment of a Stock's correlation to CAN SLIM principles. It combines a stock's Technical and Fundamental merits and is expressed as a percentage. |
Cup and Handle Stocks Likely to Breakout next Week
| Symbol |
BoP |
Company |
Industry |
Relative Strength Rank |
Within x% of BoP |
C Score* |
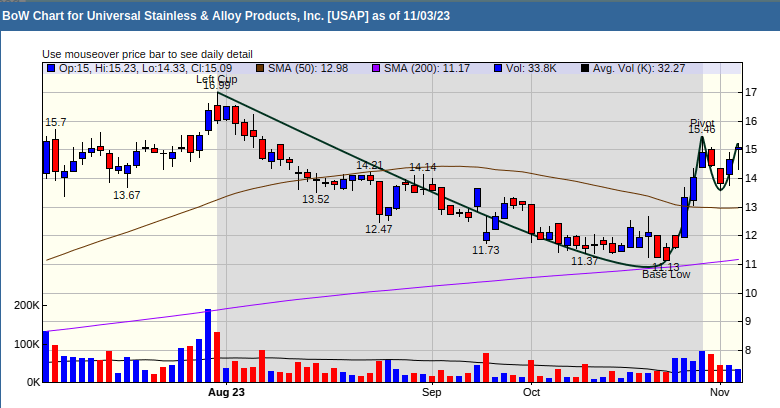
| USAP |
15.46 |
Universal Stainless & Alloy Products, Inc. |
Steel |
95.00 |
97.61 |
75.4 |
| MANH |
211.81 |
Manhattan Associates, Inc. |
Software - Application |
93.00 |
98.61 |
79.2 |
| OWL |
13.88 |
Blue Owl Capital Inc. |
Asset Management |
87.00 |
95.53 |
76.1 |
| ARLP |
24.30 |
Alliance Resource Partners, L.P. |
Thermal Coal |
84.00 |
98.77 |
74.5 |
| *C score is our assessment of a Stock's correlation to CAN SLIM principles. It combines a stock's Technical and Fundamental merits and is expressed as a percentage. |
Cup and Handle Chart of the Week
Of the 4 stocks I selected as most likely to breakout in the coming week, USAP appears to be the best positioned. The chart shows strong accumulation in the right side of the cup, followed by profit taking, and then further accumulation in the handle in the handle. For an analysis of how and why a cup and handle pattern forms, see our tutorial Anatomy of a Cup-with-Handle Chart Pattern