Breakoutwatch Weekly Summary 02/15/2024
You are receiving this email because you are or were a
BreakoutWatch.com subscriber, or have subscribed to our weekly
newsletter.
To read this newsletter on the site, click here: Newsletter
.
Market Summary
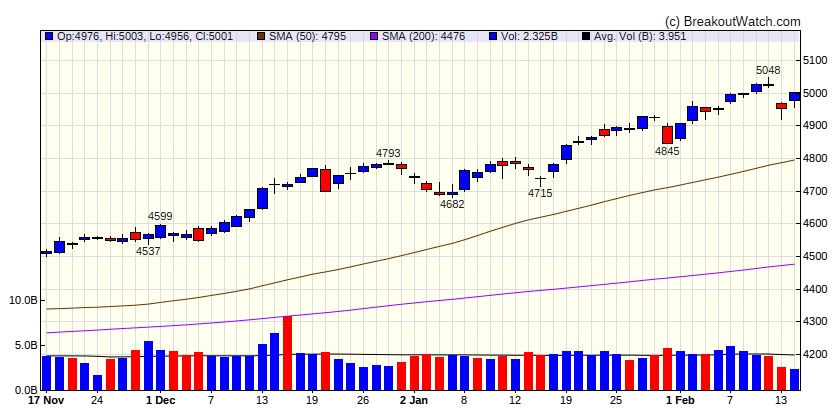
S&P 500 Index breaches 5,000 for first time as narrow advance continues
Most of the major indexes moved higher over the week, with the S&P 500 Index reaching new highs and breaching the 5,000 threshold for the first time. The advance remained relatively narrow, however, with an equally weighted version of the index significantly trailing the standard market-weighted version for the fourth time in five weeks. T. Rowe Price traders also noted a downward trend in the number of stocks that remained above their 50-day moving average. The narrowness may have reflected in part a relative dearth of economic data, leaving investors to focus more on individual companies’ earnings reports. [more...]
Major Index Performance
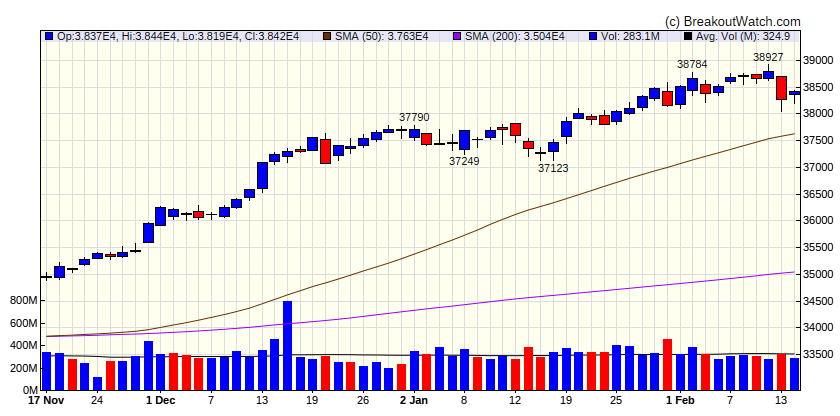
| Dow Jones
|
| Last Close
| 38424.3 |
| Wk. Gain
| -0.79 % |
| Yr. Gain
| 2.28 % |
| Trend
| Up |
|
| S&P 500
|
| Last Close
| 5000.62 |
| Wk. Gain
| -0.07 % |
| Yr. Gain
| 5.39 % |
| Trend
| Up |
|
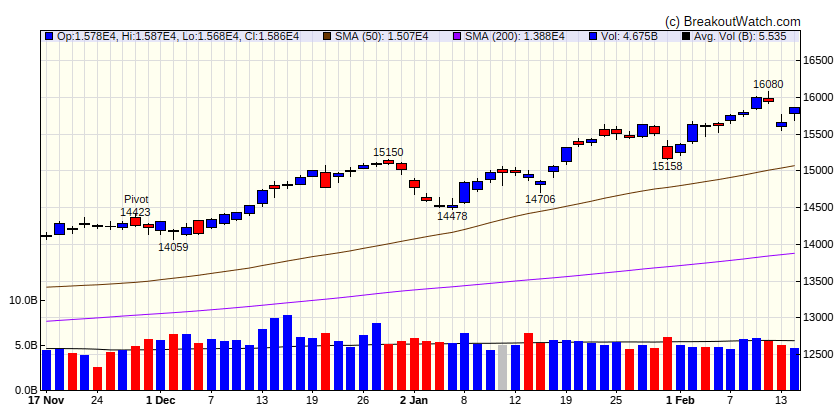
| NASDAQ Comp.
|
| Last Close
| 15859.2 |
| Wk. Gain
| 0.11 % |
| Yr. Gain
| 6.62 % |
| Trend
| Up |
|
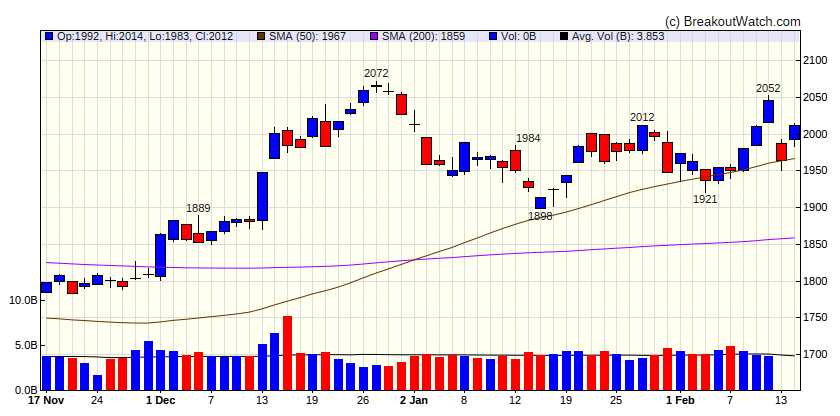
| Russell 2000
|
| Last Close
| 2012.1 |
| Wk. Gain
| 1.42 % |
| Yr. Gain
| -0.04 % |
| Trend
| Up |
|
Performance by Sector
| Sector |
Wk. Change % |
Yr. Change % |
Trend |
| Consumer Discretionary |
-0.18 |
0.7 |
Up |
| Consumer Staples |
-1.1 |
1.37 |
Up |
| Energy |
-1.46 |
-1.7 |
Up |
| Finance |
0.58 |
3.47 |
Up |
| Health Care |
0.13 |
5.67 |
Up |
| Industrials |
0.81 |
4.01 |
Up |
| Technology |
-0.42 |
7.71 |
Up |
| Materials |
0.2 |
-2.69 |
Up |
| REIT |
-1.06 |
-5.38 |
Down |
| Telecom |
0.38 |
9.7 |
Up |
| Utilities |
0.71 |
-4.28 |
Down |
Breakouts This Week Still Within 5% of Breakout Price (Limit 20 top C Score)
| Watchlist |
Symbol |
Company |
Industry |
C Score* |
% Gain |
| SQZ |
CECO |
CECO Environmental Corp. |
Chemicals |
80.1 % |
3.6 % |
| SQZ |
STRL |
Sterling Infrastructure, Inc. |
Biotechnology |
79.7 % |
4.5 % |
| SQZ |
SSD |
Simpson Manufacturing Company, Inc. |
Banks - Regional |
79.1 % |
0.2 % |
| CWH |
CSPI |
CSP Inc. |
Information Technology Services |
77.4 % |
4.2 % |
| SQZ |
KTB |
Kontoor Brands, Inc. |
Apparel Manufacturing |
74.6 % |
0.1 % |
| SQZ |
IOT |
Samsara Inc. |
Software - Infrastructure |
74.4 % |
0.8 % |
| SQZ |
TIMB |
TIM S.A. American Depositary Shares (Each represen |
Telecom Services |
73.2 % |
0.7 % |
| CWH |
RDNT |
RadNet, Inc. |
Insurance - Specialty |
72.7 % |
0.9 % |
| SQZ |
JXN |
Jackson Financial Inc. |
Insurance - Life |
72.2 % |
0.4 % |
| CWH |
ZYXI |
Zynex, Inc. |
Medical Distribution |
71.9 % |
1.3 % |
| SQZ |
FEIM |
Frequency Electronics, Inc. |
Communication Equipment |
71.9 % |
1.2 % |
| DB |
OLED |
Universal Display Corporation |
Electronic Components |
71.8 % |
1.1 % |
| CWH |
BRZE |
Braze, Inc. |
Software - Application |
70.6 % |
2.7 % |
| SQZ |
HNI |
HNI Corporation |
Gold |
70.3 % |
3.9 % |
| SQZ |
SCS |
Steelcase Inc. |
Shell Companies |
69 % |
1.9 % |
| SQZ |
GRBK |
Green Brick Partners, Inc. |
Residential Construction |
68.3 % |
2.7 % |
| SQZ |
ITCI |
Intra-Cellular Therapies Inc. |
Information Technology Services |
68.3 % |
5 % |
| CWH |
LCUT |
Lifetime Brands, Inc. |
Biotechnology |
65.7 % |
1.2 % |
| DB |
EA |
Electronic Arts Inc. |
Biotechnology |
65.3 % |
2.1 % |
| SQZ |
EEX |
Emerald Holding, Inc. |
Advertising Agencies |
65.3 % |
4.5 % |
| *C score is our assessment of a Stock's correlation to CAN SLIM principles. It combines a stock's Technical and Fundamental merits and is expressed as a percentage. |
Breakdowns within 5% of Breakdown Price
| Watchlist |
Symbol |
Company |
Industry |
C Score* |
% Loss |
| SS |
PNFP |
Pinnacle Financial Partners, Inc. |
Banks - Regional |
70 % |
-1 % |
| SS |
ROKU |
Roku, Inc. |
Entertainment |
68.7 % |
-3.5 % |
| SS |
UDMY |
Udemy, Inc. |
Telecom Services |
67.5 % |
-2.3 % |
| SS |
AVPT |
AvePoint, Inc. |
Software - Infrastructure |
65.2 % |
-1 % |
| SS |
HBIO |
Harvard Bioscience, Inc. |
Apparel Manufacturing |
57.3 % |
-2.3 % |
| SS |
RH |
RH |
Specialty Retail |
55.4 % |
-0.2 % |
| SS |
IAG |
Iamgold Corporation Ordin |
Gold |
53.1 % |
-1.2 % |
| SS |
VTLE |
Vital Energy, Inc. |
Biotechnology |
53.1 % |
-0.5 % |
| *C score is our assessment of a Stock's correlation to CAN SLIM principles. It combines a stock's Technical and Fundamental merits and is expressed as a percentage. |
| There were no CWH stocks meeting our breakout model criteria |
| *C score is our assessment of a Stock's correlation to CAN SLIM principles. It combines a stock's Technical and Fundamental merits and is expressed as a percentage. |
Cup and Handle Chart of the Week
There were no cup and handle stocks meeting our breakout model criteria this week.